Więcej niż dwie zmienne objaśniające

Regresja średnio zaawansowana ze statsmodels w Pythonie

Maarten Van den Broeck

Content Developer at DataCamp

Z poprzedniego odcinka
sns.scatterplot(x="length_cm", 
                y="height_cm",
                data=fish,
                hue="mass_g")

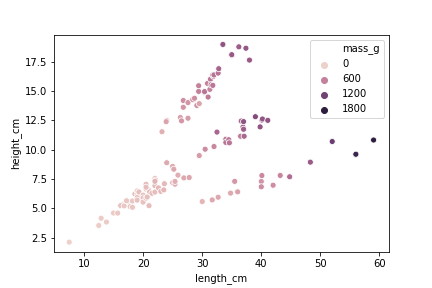
Wykres punktowy 2D z masą zakodowaną kolorem jako trzecia zmienna numeryczna.

Regresja średnio zaawansowana ze statsmodels w Pythonie

Podział na gatunki (faceting)

grid = sns.FacetGrid(data=fish,

col="species",
hue="mass_g", col_wrap=2,
palette="plasma")
grid.map(sns.scatterplot,
         "length_cm",
         "height_cm")
plt.show()

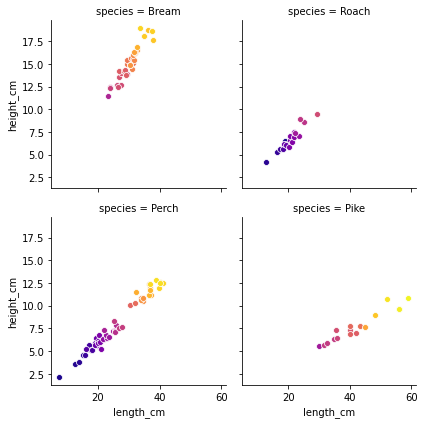
Wykres punktowy wysokości, długości i masy ryb z podziałem na gatunki. Jaśniejszy kolor oznacza cięższą rybę.

Regresja średnio zaawansowana ze statsmodels w Pythonie

Podział na gatunki (faceting)

  • Można używać więcej niż jednej zmiennej kategorycznej do podziału na panele
  • Należy unikać nadmiernego stosowania facetingu
  • Wizualizacja staje się trudniejsza wraz ze wzrostem liczby zmiennych

Wykres punktowy wysokości, długości i masy ryb z podziałem na gatunki. Jaśniejszy kolor oznacza cięższą rybę.

Regresja średnio zaawansowana ze statsmodels w Pythonie

Różne poziomy interakcji

Brak interakcji

ols("mass_g ~ length_cm + height_cm + species + 0", data=fish).fit()

interakcje dwukierunkowe między parami zmiennych

ols(
  "mass_g ~ length_cm + height_cm + species +
  length_cm:height_cm + length_cm:species + height_cm:species + 0", data=fish).fit()

interakcja trójkierunkowa między wszystkimi trzema zmiennymi

ols(
  "mass_g ~ length_cm + height_cm + species + 
  length_cm:height_cm + length_cm:species + height_cm:species + length_cm:height_cm:species + 0", data=fish).fit()
Regresja średnio zaawansowana ze statsmodels w Pythonie

Wszystkie interakcje

ols(
  "mass_g ~ length_cm + height_cm + species + 
  length_cm:height_cm + length_cm:species + height_cm:species + length_cm:height_cm:species + 0", 
  data=fish).fit()

to samo co

ols(
  "mass_g ~ length_cm * height_cm * species + 0", 
  data=fish).fit()
Regresja średnio zaawansowana ze statsmodels w Pythonie

Tylko interakcje dwukierunkowe

ols(
  "mass_g ~ length_cm + height_cm + species + 
  length_cm:height_cm + length_cm:species + height_cm:species + 0", 
  data=fish).fit()

to samo co

ols(
  "mass_g ~ (length_cm + height_cm + species) ** 2 + 0", 
  data=fish).fit()
Regresja średnio zaawansowana ze statsmodels w Pythonie

Przepływ predykcji

mdl_mass_vs_all = ols(
  "mass_g ~ length_cm * height_cm * species + 0",
  data=fish).fit()

length_cm = np.arange(5, 61, 5)
height_cm = np.arange(2, 21, 2)
species = fish["species"].unique()

p = product(length_cm, height_cm, species)

explanatory_data = pd.DataFrame(p,
                                columns=["length_cm",
                                         "height_cm",
                                         "species"])

prediction_data = explanatory_data.assign(
  mass_g = mdl_mass_vs_all.predict(explanatory_data))

print(prediction_data)
     length_cm  height_cm species       mass_g
0            5          2   Bream  -570.656437
1            5          2   Roach    31.449145
2            5          2   Perch    43.789984
3            5          2    Pike   271.270093
4            5          4   Bream  -451.127405
..         ...        ...     ...          ...
475         60         18    Pike  2690.346384
476         60         20   Bream  1531.618475
477         60         20   Roach  2621.797668
478         60         20   Perch  3041.931709
479         60         20    Pike  2926.352397

[480 rows x 4 columns]
Regresja średnio zaawansowana ze statsmodels w Pythonie

Czas na ćwiczenia!

Regresja średnio zaawansowana ze statsmodels w Pythonie

Preparing Video For Download...