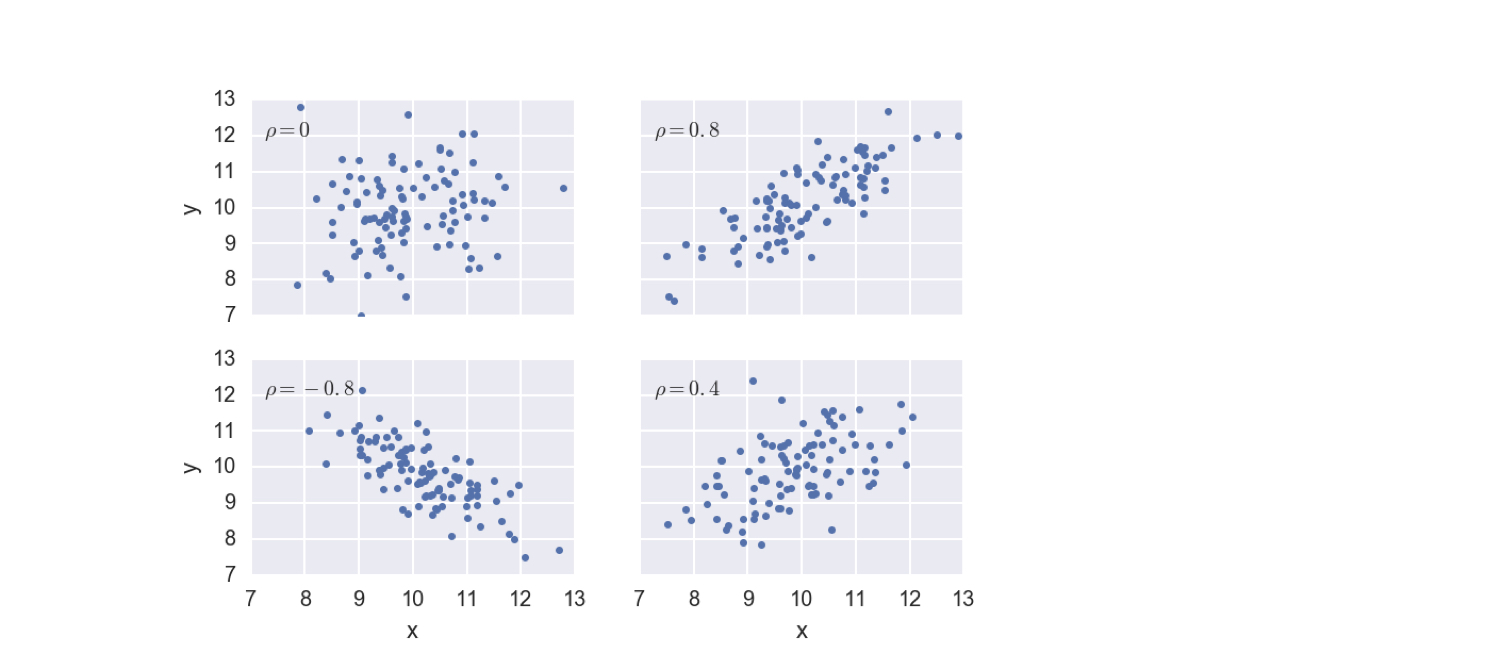
Kowariancja i współczynnik korelacji Pearsona
Myślenie statystyczne w Pythonie (część 1)

Justin Bois
Teaching Professor at the California Institute of Technology
Wyniki wyborów w stanach wahających się w USA w 2008 r.
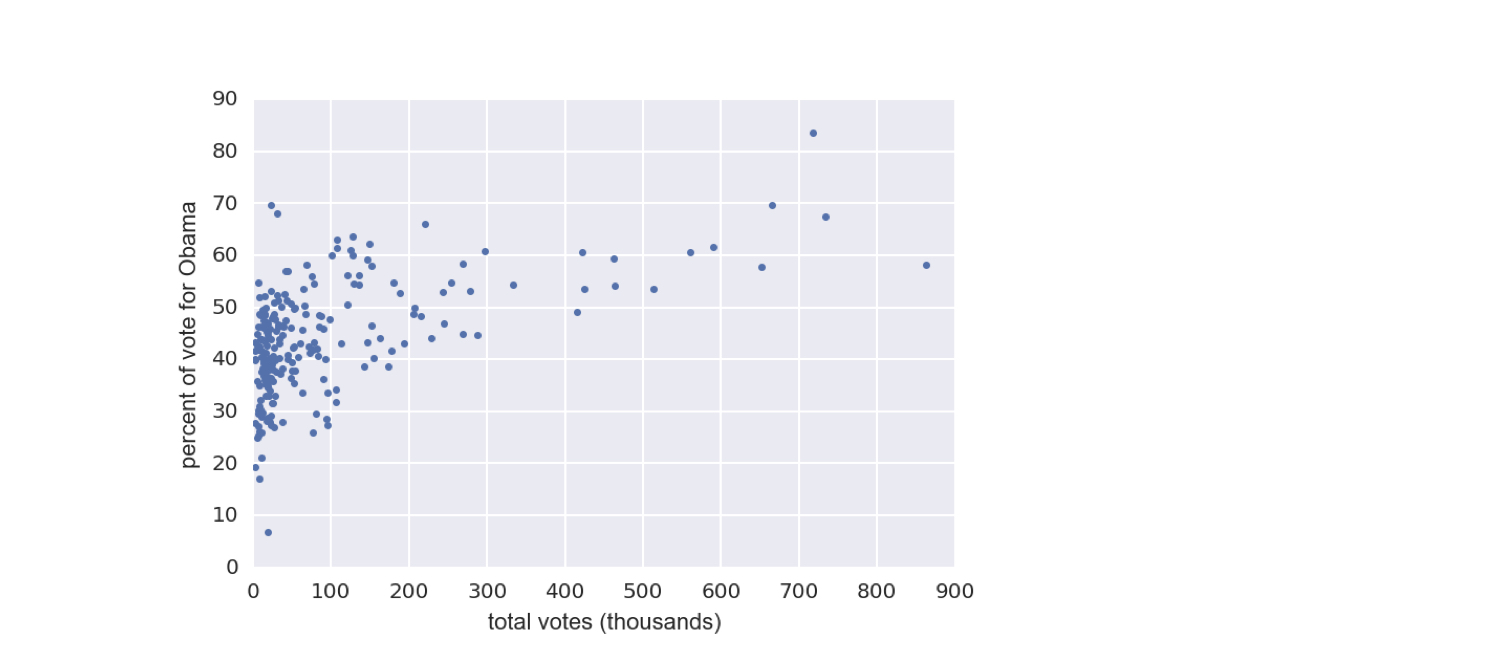
1 Dane pobrane z Data.gov (https://www.data.gov/)
Wyniki wyborów w stanach wahających się w USA w 2008 r.
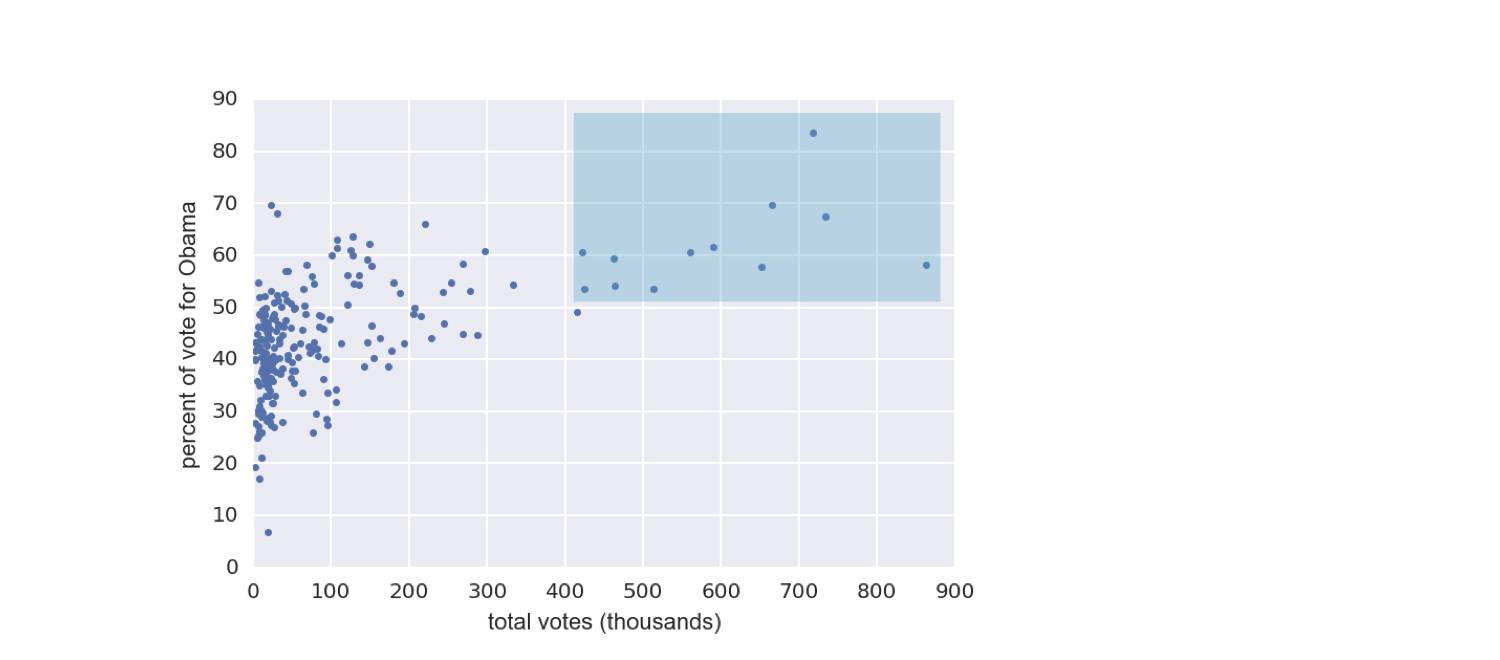
1 Dane pobrane z Data.gov (https://www.data.gov/)
Wyniki wyborów w stanach wahających się w USA w 2008 r.
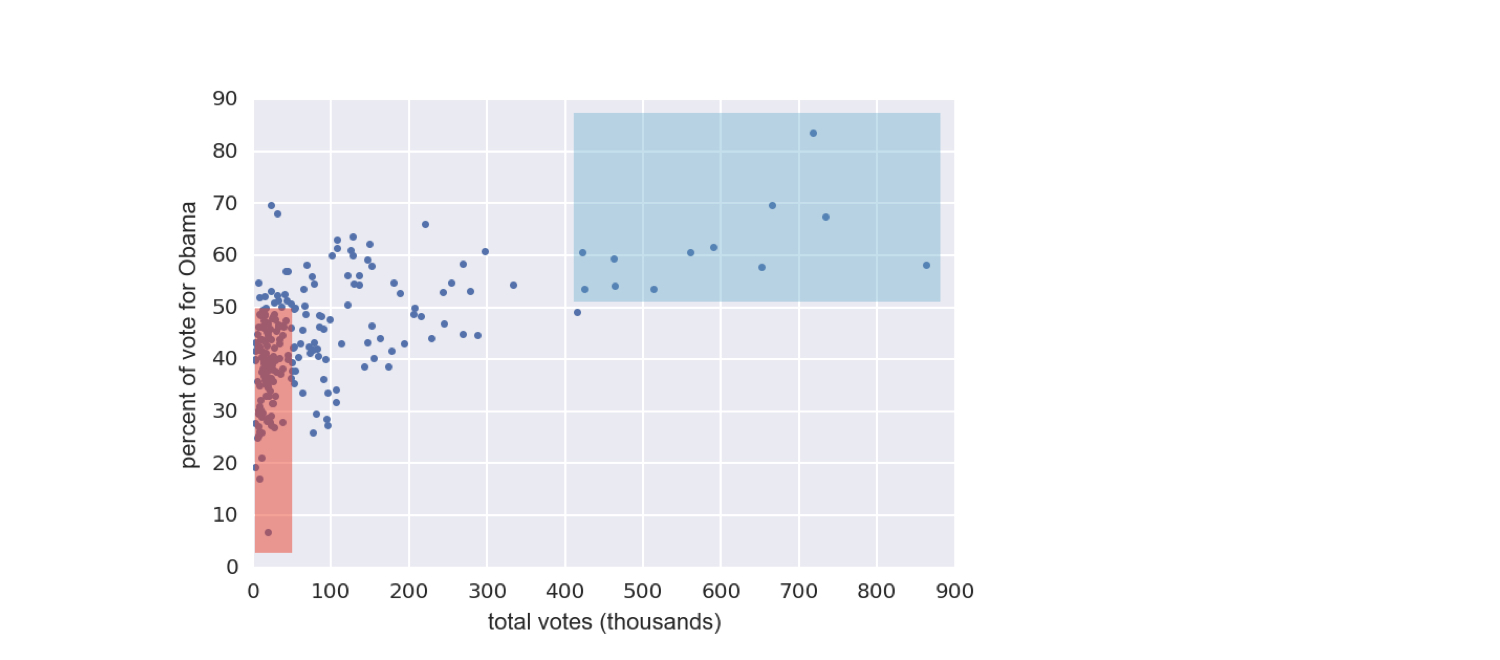
1 Dane pobrane z Data.gov (https://www.data.gov/)
Obliczanie kowariancji
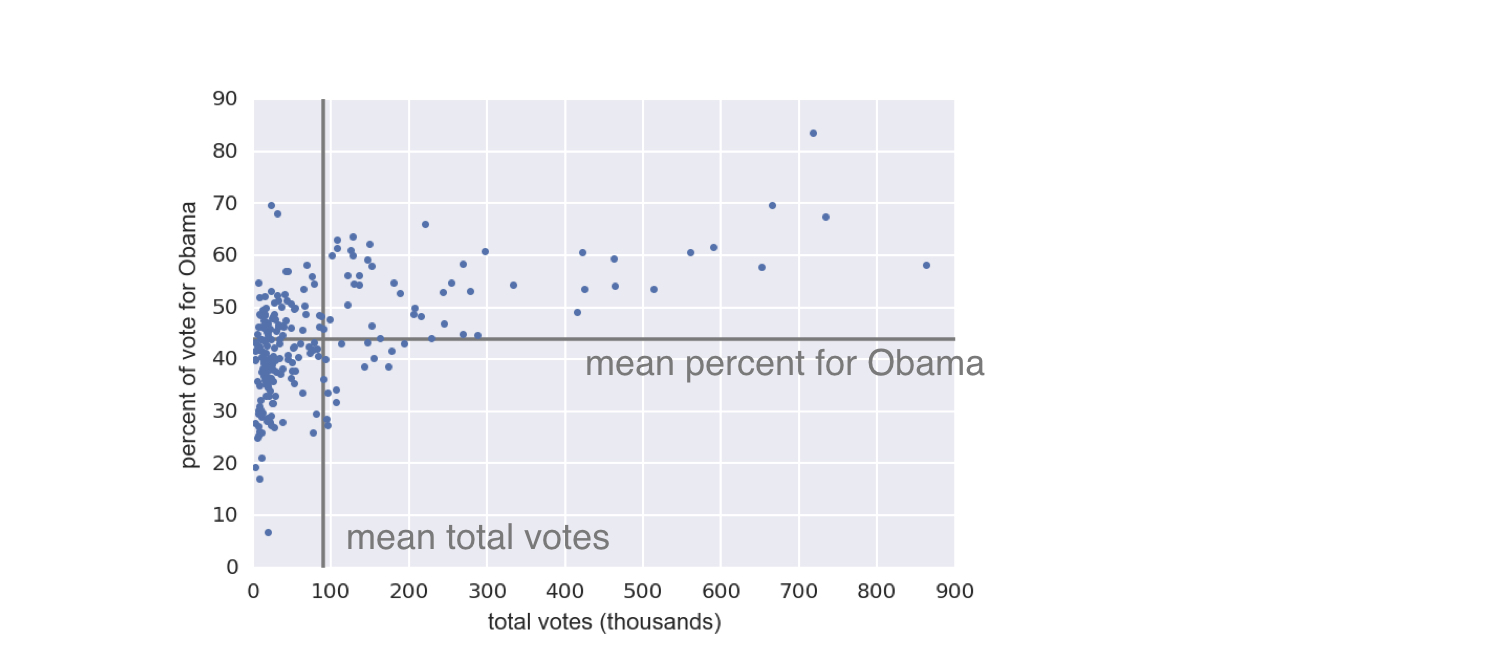
1 Dane pobrane z Data.gov (https://www.data.gov/)
Obliczanie kowariancji
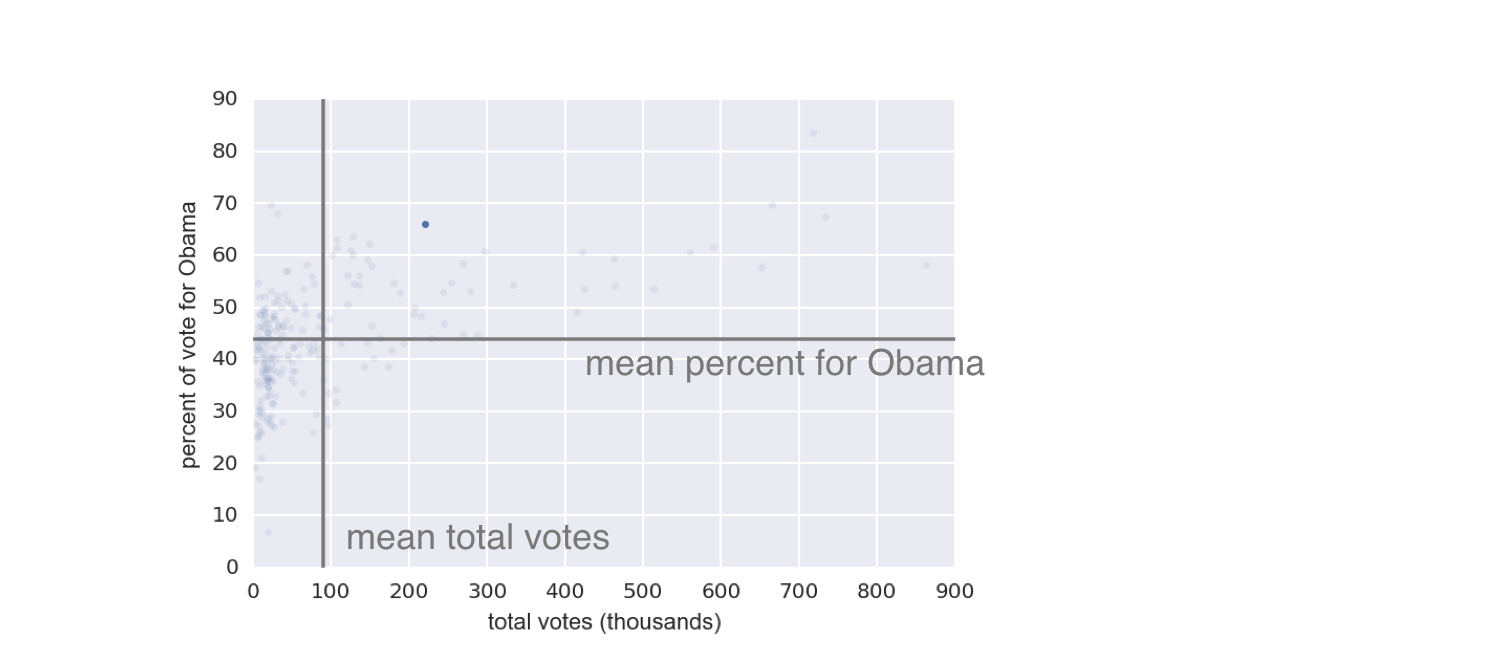
1 Dane pobrane z Data.gov (https://www.data.gov/)
Obliczanie kowariancji
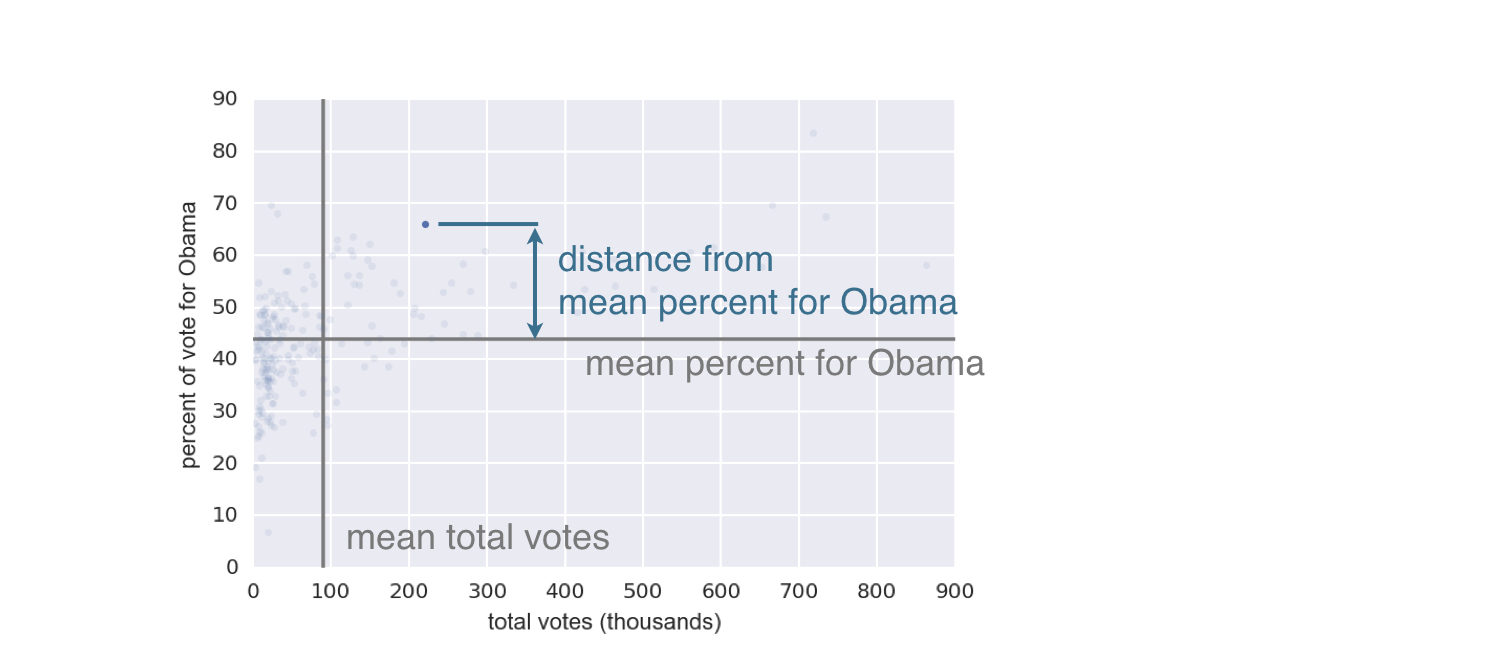
1 Dane pobrane z Data.gov (https://www.data.gov/)
Obliczanie kowariancji
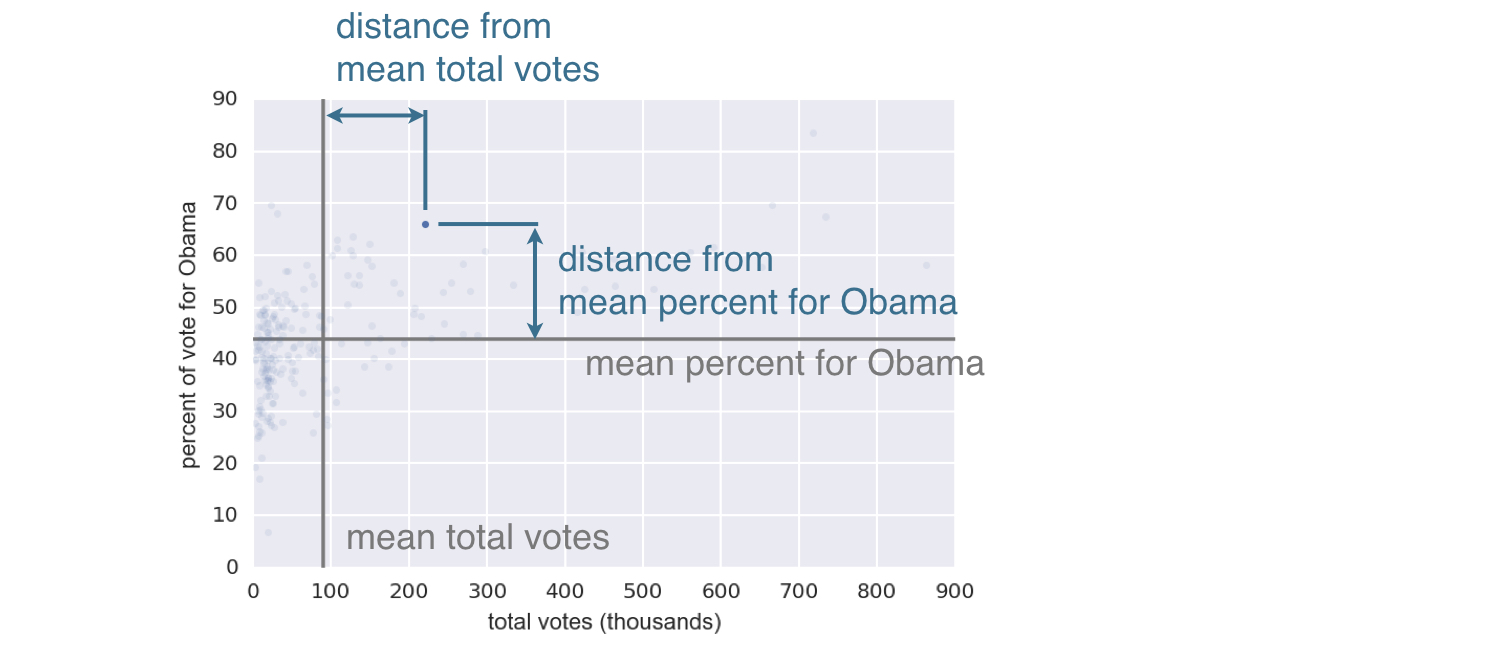
$$covariance = \frac{1}{n}\sum_{i=1}^{n}(x_i - \bar{x})(y_i - \bar{y})$$
1 Dane pobrane z Data.gov (https://www.data.gov/)
Przykłady współczynnika korelacji Pearsona