Wykonywanie PCA w R
Algebra liniowa dla data science w R

Eric Eager
Data Scientist at Pro Football Focus
Dane NFL Combine
head(select(combine, height:shuttle))
  height weight forty vertical bench broad_jump three_cone shuttle
1     71    192  4.38     35.0    14        127       6.71    3.98
2     73    298  5.34     26.5    27         99       7.81    4.71
3     77    256  4.67     31.0    17        113       7.34    4.38
4     74    198  4.34     41.0    16        131       6.56    4.03
5     76    257  4.87     30.0    20        118       7.12    4.23
6     78    262  4.60     38.5    18        128       7.53    4.48
Dane NFL Combine
prcomp(A)
Standard deviations (1, .., p=8):
[1] 46.7720885  6.6356959  4.7108443  2.2950226  1.6430770  0.2513368  0.1216908  0.1143365

Rotation (n x k) = (8 x 8):
                    PC1          PC2           PC3           PC4          PC5          PC6           PC7           PC8
height      0.042047079 -0.061885367  0.1454490039 -0.1040556410 -0.980792060  0.020679696 -6.155636e-03  0.0008055445
weight      0.980711529 -0.130912788  0.1270100265  0.0193388930  0.066908382 -0.008423587  6.988341e-04  0.0036087841
forty       0.006112061  0.012525260  0.0025260713 -0.0021291637  0.004096693  0.152469227 -2.539868e-01 -0.9549983725
vertical   -0.062926466 -0.333556369  0.0398922845  0.9366594549 -0.074901137  0.012214516  7.045063e-03 -0.0070051256
bench       0.088291423 -0.313533433 -0.9363461471 -0.0745692157 -0.107188391  0.009167322 -8.604309e-05 -0.0048308793
broad_jump -0.156742686 -0.876925849  0.2904565302 -0.3252903706  0.126494599  0.013753112 -2.187651e-03 -0.0076907609
three_cone  0.007468520  0.014691994  0.0009057581  0.0003320888  0.020902644  0.894560357 -3.743559e-01  0.2427137770
shuttle     0.004518826  0.009863931  0.0023111814 -0.0094052914  0.004010629  0.419039274  8.917710e-01 -0.1700673446
Dane NFL Combine
summary(prcomp(A))
Importance of components:
                           PC1     PC2     PC3     PC4     PC5     PC6     PC7     PC8
Standard deviation     46.7721 6.63570 4.71084 2.29502 1.64308 0.25134 0.12169 0.11434
Proportion of Variance  0.9672 0.01947 0.00981 0.00233 0.00119 0.00003 0.00001 0.00001
Cumulative Proportion   0.9672 0.98663 0.99644 0.99877 0.99996 0.99999 0.99999 1.00000
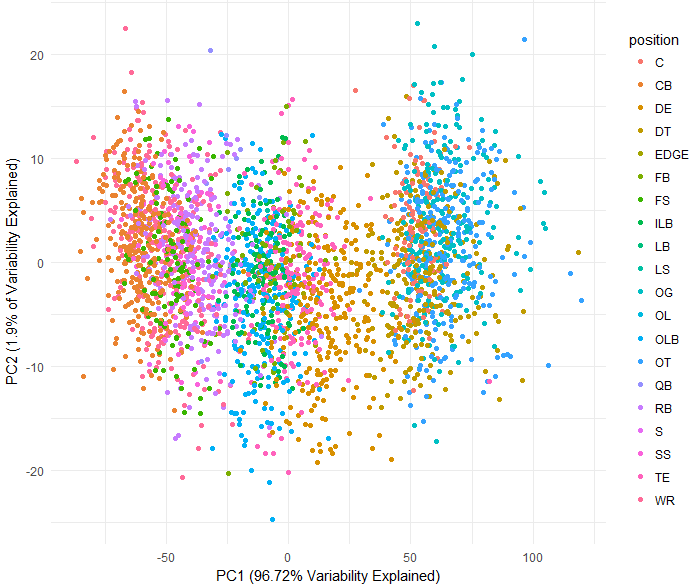
head(prcomp(A)$x[, 1:2])
            PC1        PC2
[1,] -62.005067  -2.654645
[2,]  48.123290   6.693433
[3,]   3.732016   1.283046
[4,] -56.823742  -9.764098
[5,]   4.213670  -3.779862
[6,]   6.924978 -15.530509
head(cbind(combine[, 1:4], prcomp(A)$x[, 1:2]))
             player position       school year        PC1        PC2
1   Jaire Alexander       CB   Louisville 2018 -62.005067  -2.654645
2       Brian Allen        C Michigan St. 2018  48.123290   6.693433
3      Mark Andrews       TE     Oklahoma 2018   3.732016   1.283046
4         Troy Apke        S     Penn St. 2018 -56.823742  -9.764098
5 Dorance Armstrong     EDGE       Kansas 2018   4.213670  -3.779862
6         Ade Aruna       DE       Tulane 2018   6.924978 -15.530509
Co robić po PCA
- Przetwarzanie/kontrola jakości danych
- Wizualizacja danych
- Uczenie nienadzorowane (klasteryzacja)
- Uczenie nadzorowane (predykcja lub wyjaśnianie)
- I wiele więcej!
Przykład – wizualizacja danych
Czas na ćwiczenia!
Algebra liniowa dla data science w R

