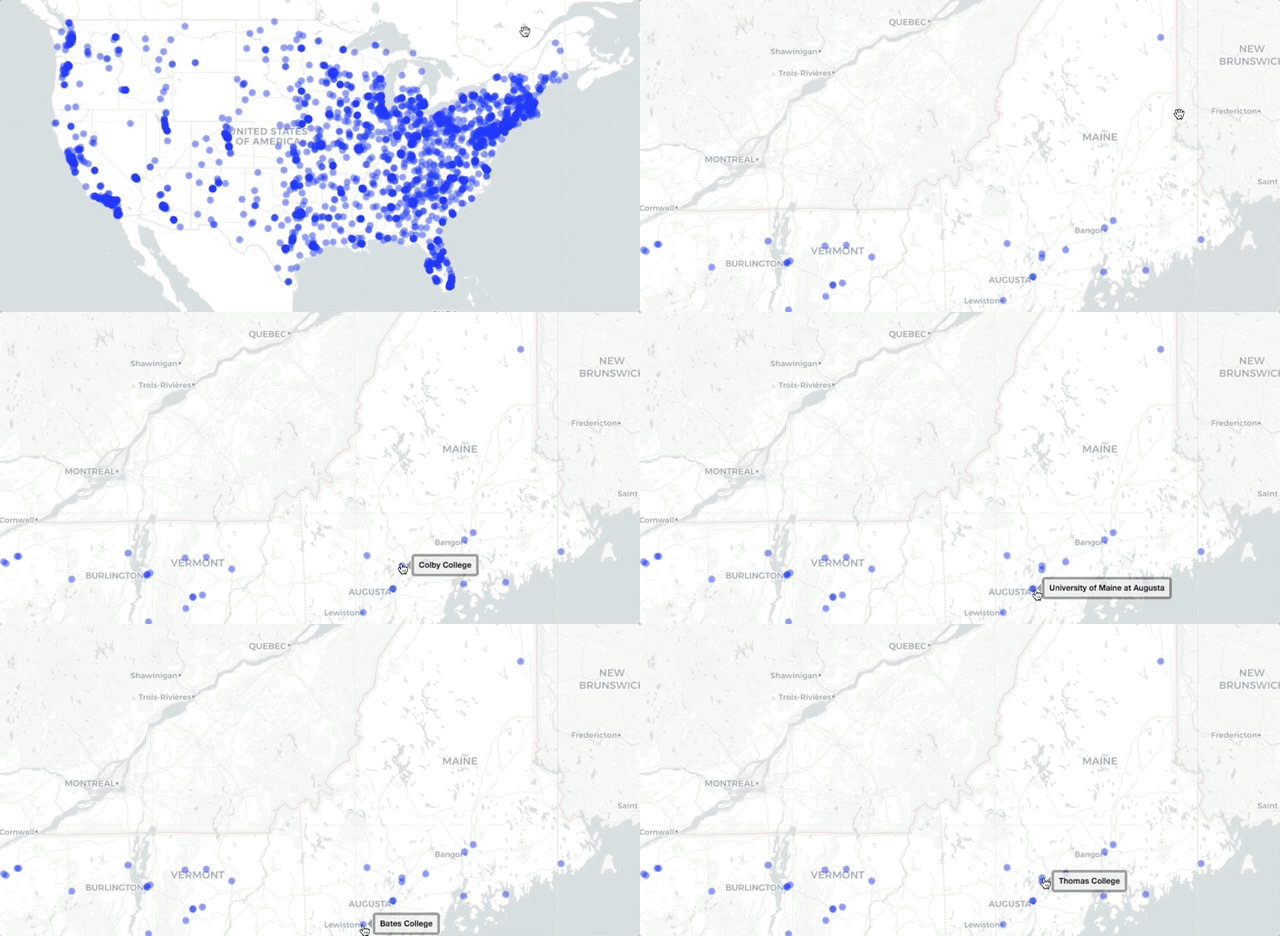
Etykiety i wyskakujące okna
Interaktywne mapy z leaflet w R

Rich Majerus
Vice President of Strategy & Planning, Queens University of Charlotte
Potokowanie i operator ~
ipeds %>%
 leaflet() %>%
 addProviderTiles("CartoDB") %>%
 addCircleMarkers(
               lng = ~lng,
               lat = ~lat,
               popup = ~name,
               color = "#FF0000")

# ipeds is specified 3 times
leaflet() %>%
  addProviderTiles("CartoDB") %>%
  addCircleMarkers(
              lng = ipeds$lng,
              lat = ipeds$lat,
              popup = ipeds$name,
              color = "red")
Wszystkie kolory

Tworzenie lepszego wyskakującego okna
addCircleMarkers(popup = ~name)addCircleMarkers(popup = ~paste0(name, "-", sector_label)addCircleMarkers(popup = ~paste0("<b>",name,"</b>"," <br/>",sector_label))

Etykiety
ipeds %>%
    leaflet()  %>%
    addProviderTiles("CartoDB")  %>%
    addCircleMarkers(label = ~name, radius = 2)