Wykresy regresji
Wizualizacja danych z Seaborn – poziom średniozaawansowany

Chris Moffitt
Instructor
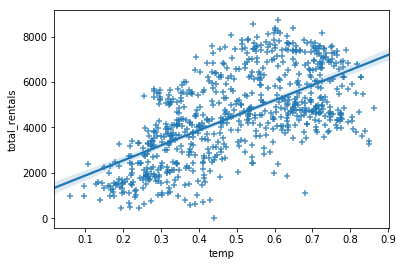
Tworzenie wykresów za pomocą regplot()
sns.regplot(data=df, x='temp',
            y='total_rentals', marker='+')
Ocena regresji za pomocą residplot()
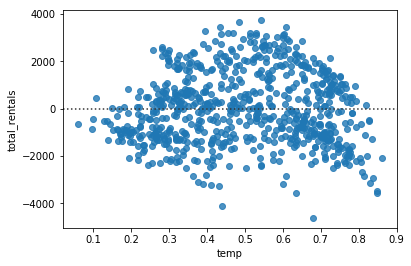
- Wykres reszt jest przydatny do oceny dopasowania modelu
- Seaborn udostępnia funkcję
residplot
sns.residplot(data=df, x='temp', y='total_rentals')
Regresja wielomianowa
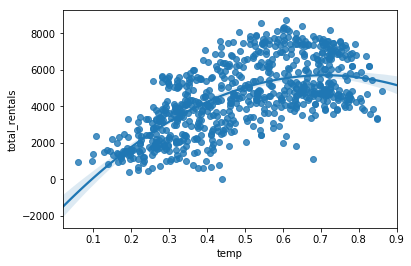
- Seaborn obsługuje regresję wielomianową za pomocą parametru
order
sns.regplot(data=df, x='temp',
            y='total_rentals', order=2)
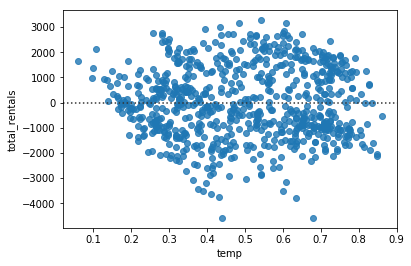
residplot z regresją wielomianową
sns.residplot(data=df, x='temp',
              y='total_rentals', order=2)
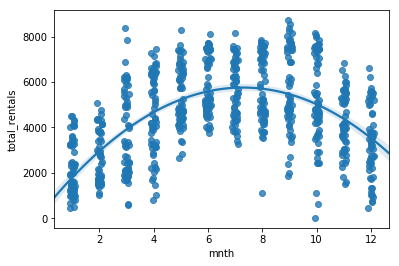
Wartości kategoryczne
sns.regplot(data=df, x='mnth', y='total_rentals',
            x_jitter=.1, order=2)
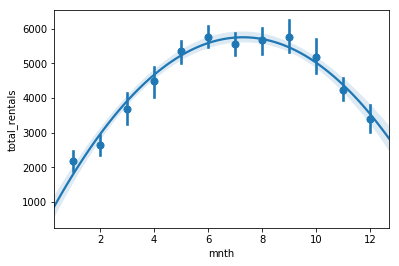
Estymatory
- W niektórych przypadkach
x_estimatormoże pomóc w uwidocznieniu trendów
sns.regplot(data=df, x='mnth', y='total_rentals',
            x_estimator=np.mean, order=2)
Podział danych na przedziały
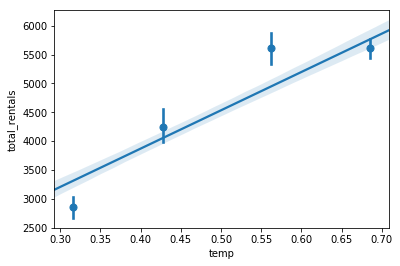
x_binssłuży do podziału danych na dyskretne przedziały- Linia regresji jest dopasowywana do wszystkich danych
sns.regplot(data=df,x='temp',y='total_rentals',
            x_bins=4)