Analiza koszyka zakupowego w R
Christopher Bruffaerts
Statistician
Reguły ze sklepu spożywczego
library(arules)
rules = apriori(data_trx,
parameter = list(
supp = 3/7, conf=0.6, minlen=2)
)
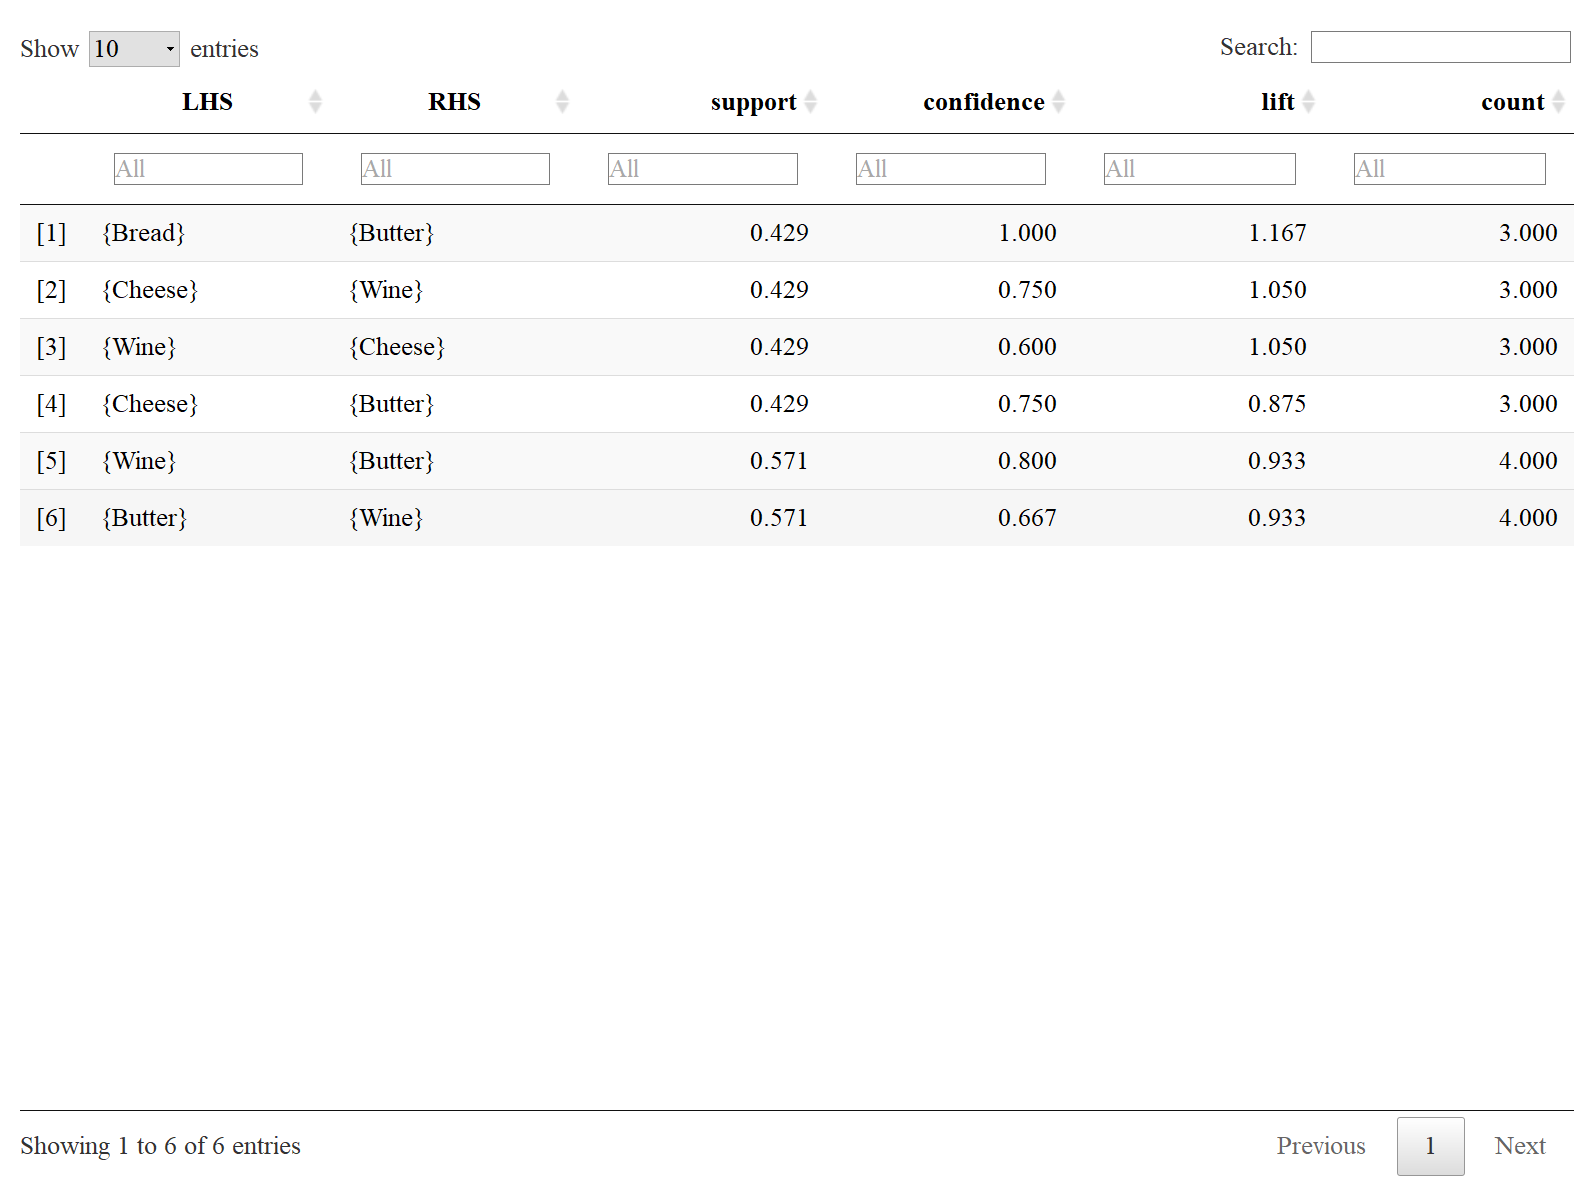
inspect(rules)
Interaktywna tabela
library(arulesViz)
inspectDT(rules)
Tabela HTML
Inspekcja reguł
inspect(rules)
lhs rhs support confidence lift count
[1] {Bread} => {Butter} 0.4285714 1.0000000 1.1666667 3
[2] {Cheese} => {Wine} 0.4285714 0.7500000 1.0500000 3
[3] {Wine} => {Cheese} 0.4285714 0.6000000 1.0500000 3
[4] {Cheese} => {Butter} 0.4285714 0.7500000 0.8750000 3
[5] {Wine} => {Butter} 0.5714286 0.8000000 0.9333333 4
[6] {Butter} => {Wine} 0.5714286 0.6666667 0.9333333 4
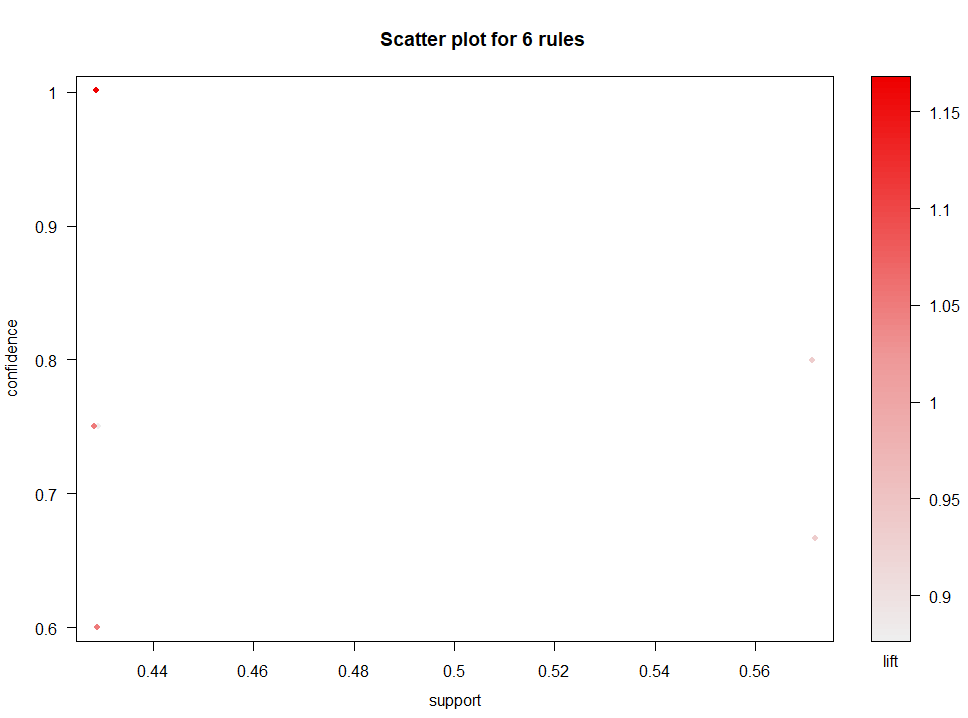
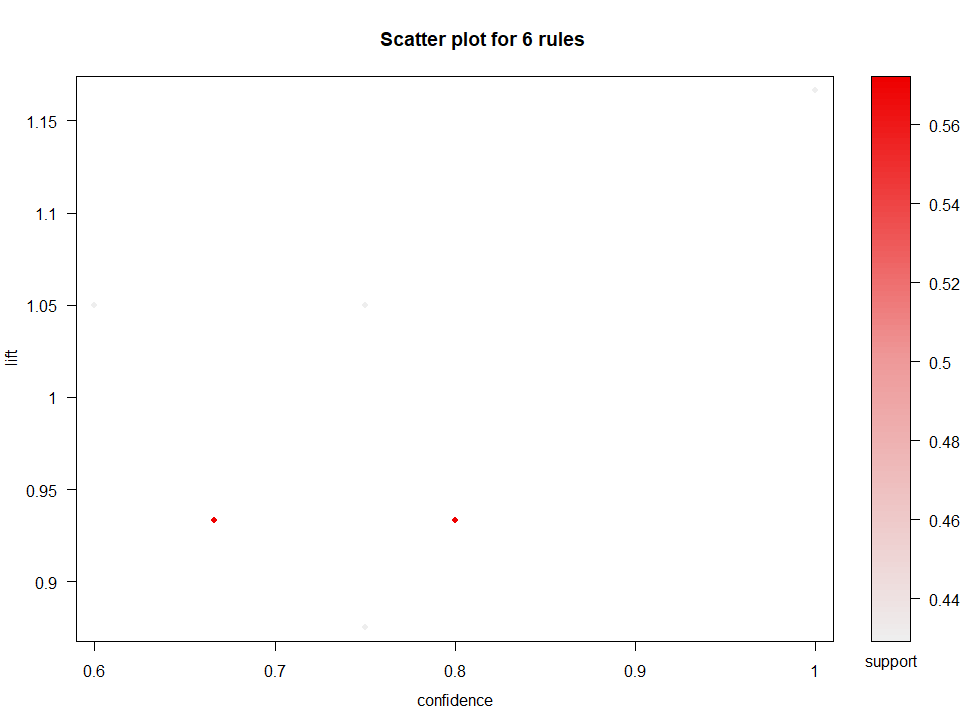
Wykres punktowy z arulesViz
plot(rules)
Opcje funkcji plot
plot(rulesObject, measure, shading, method)
rulesObject: obiekt reguł do wykreśleniameasure: miary interesującości reguł (Support, Confidence, lift,...)shading: miara używana do kolorowania punktów.method: metoda wizualizacji ("scatterplot", "matrix", "two-key plot", "matrix3D")Przykład
plot(rules, measure = c("confidence", "lift"),
shading = "support",
method = "scatterplot")
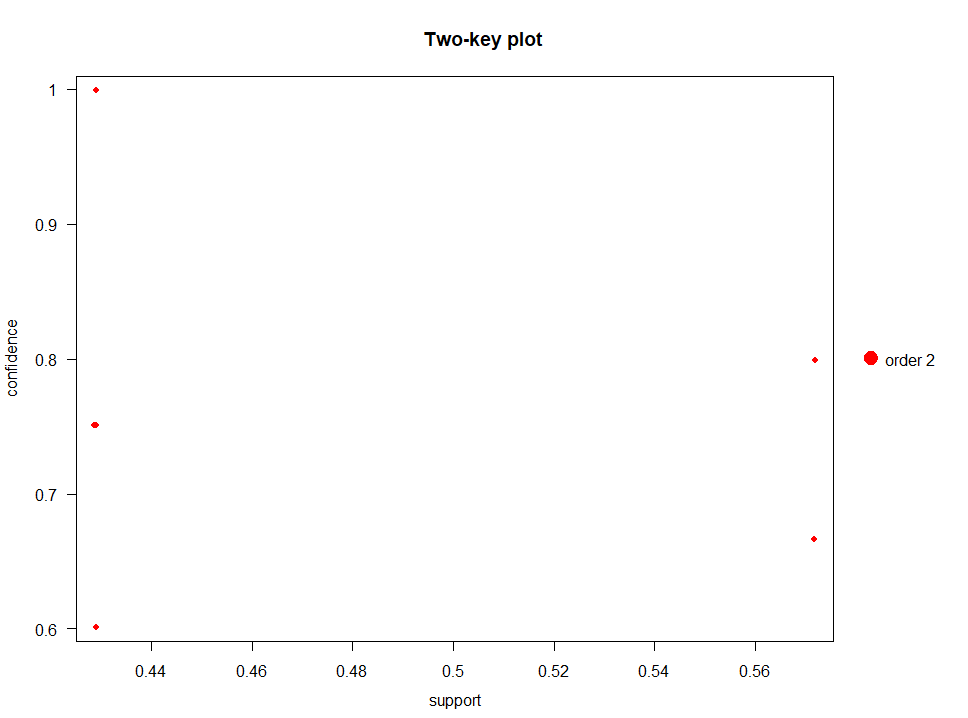
Wykres two-key plot
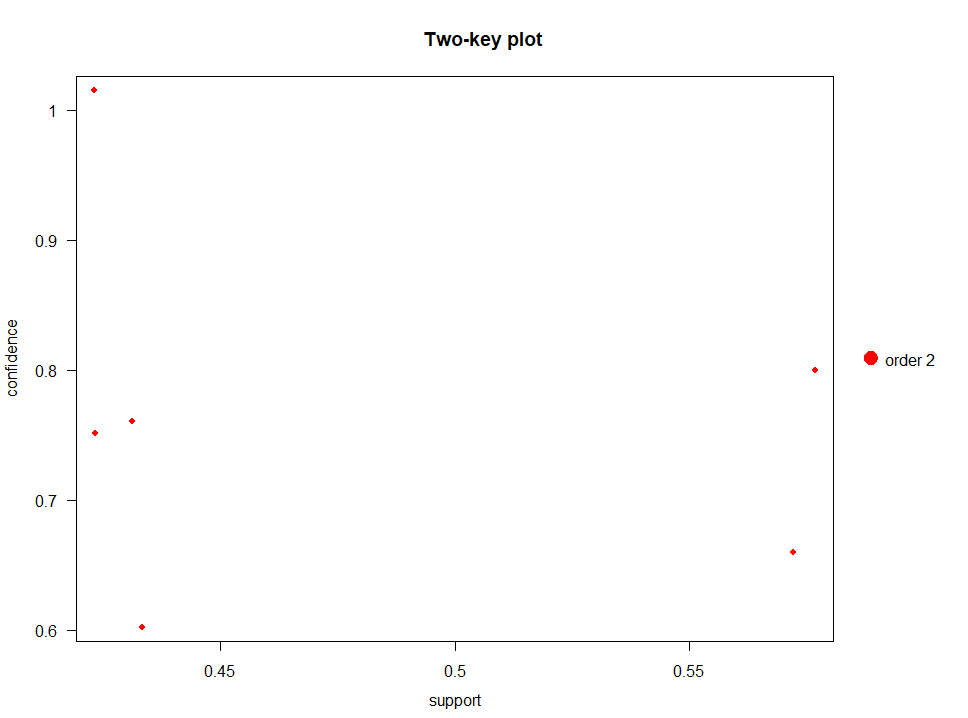
plot(rules, method = "two-key plot")

Bez jitteringu
plot(rules, method = "two-key plot")

Z jitteringiem
plot(rules, method = "two-key plot",jitter = 2)
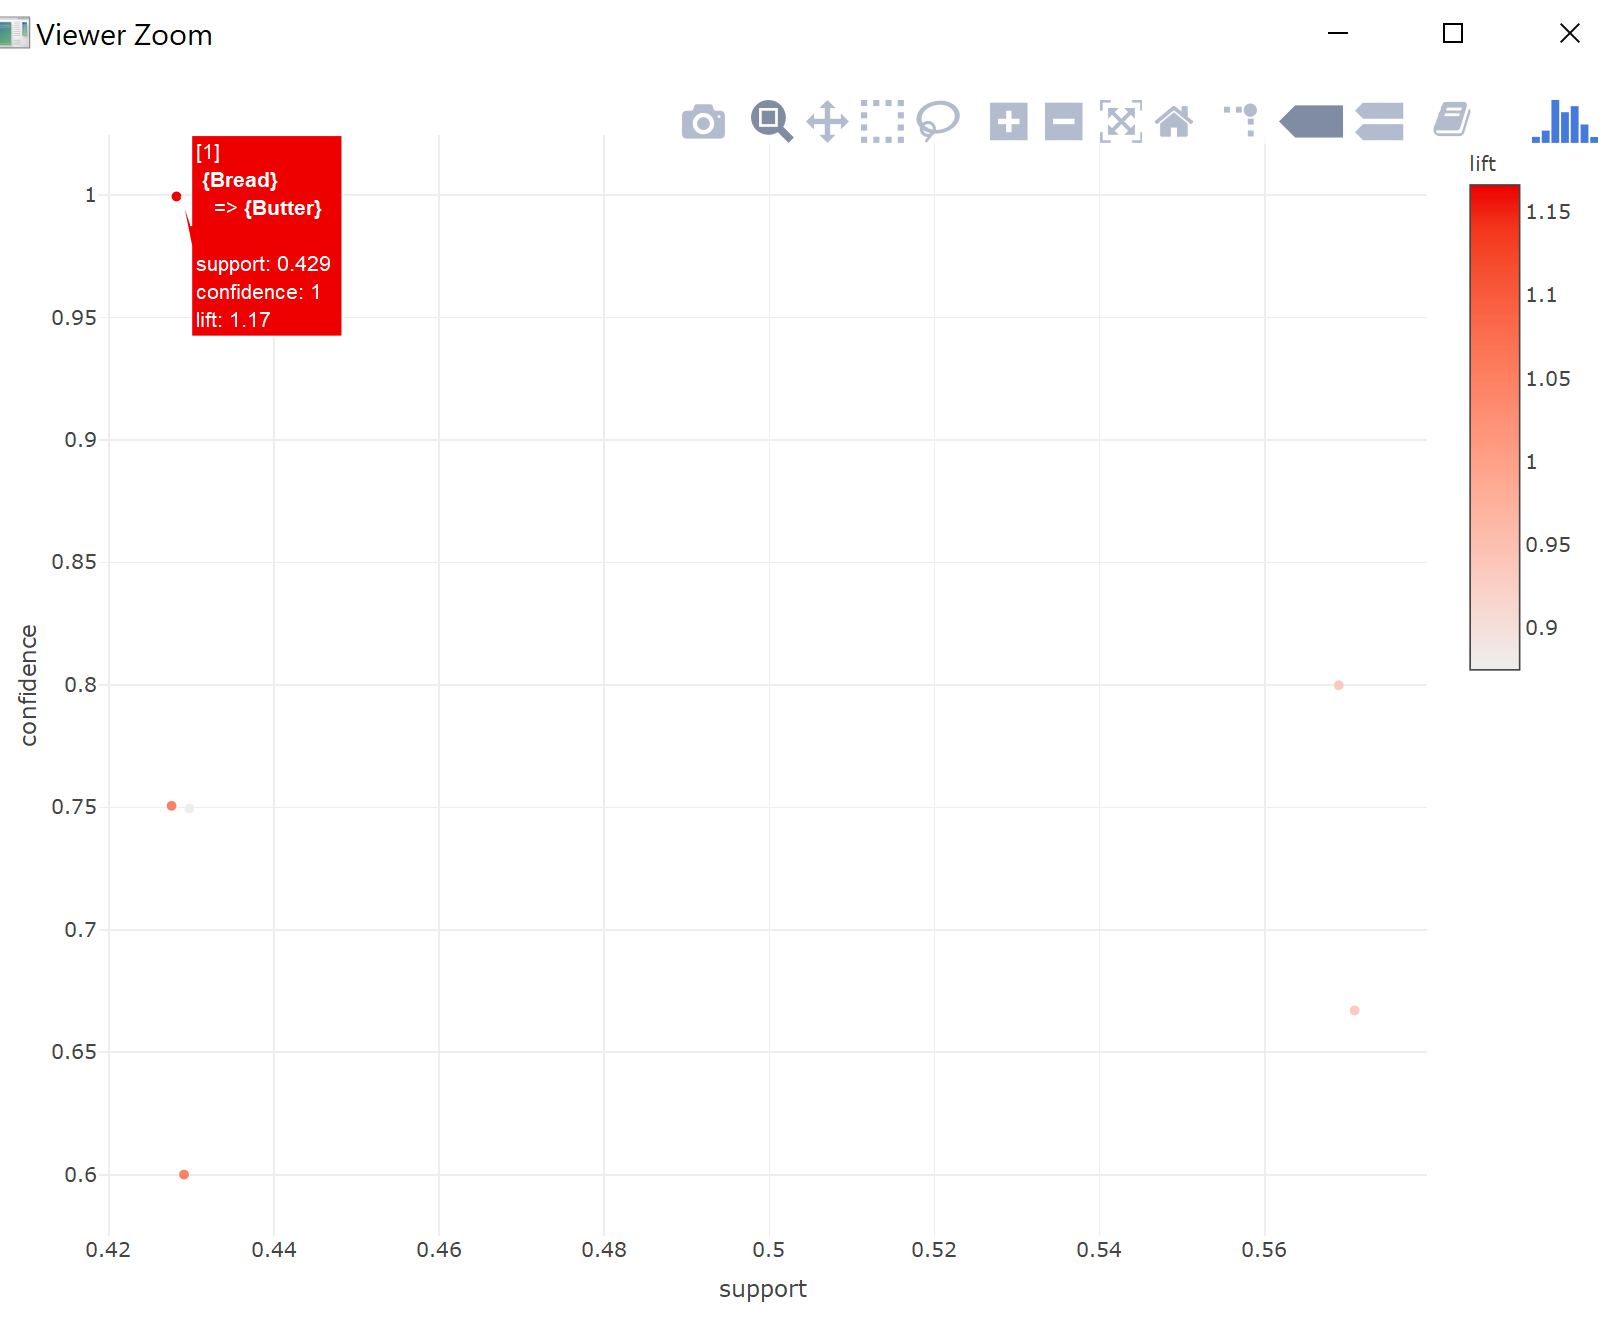
Interaktywne reguły
plot(rules, engine = "plotly")
Od statycznego do interaktywnego

Analiza koszyka zakupowego w R