Analiza koszyka zakupowego w R
Christopher Bruffaerts
Statistician
Analiza koszyka zakupów
Skupienie na czym, a nie na ile;
tj. co klienci mają w swoich koszykach?
Główne miary
Ważna uwaga
Zbiór wyodrębnionych reguł może być bardzo duży!
W takim przypadku nie należy przeglądać ani wyświetlać wszystkich reguł – zawsze używaj podzbioru reguł lub funkcji head bądź tail!
Wróćmy do sklepu spożywczego

Zbiór danych z pakietu arules
# Loading the arules package
library(arules)
# Loading the Groceries dataset
data(Groceries)
summary(Groceries)
transactions as itemMatrix in sparse format with
9835 rows (elements/itemsets/transactions) and
169 columns (items) and a density of 0.02609146
most frequent items:
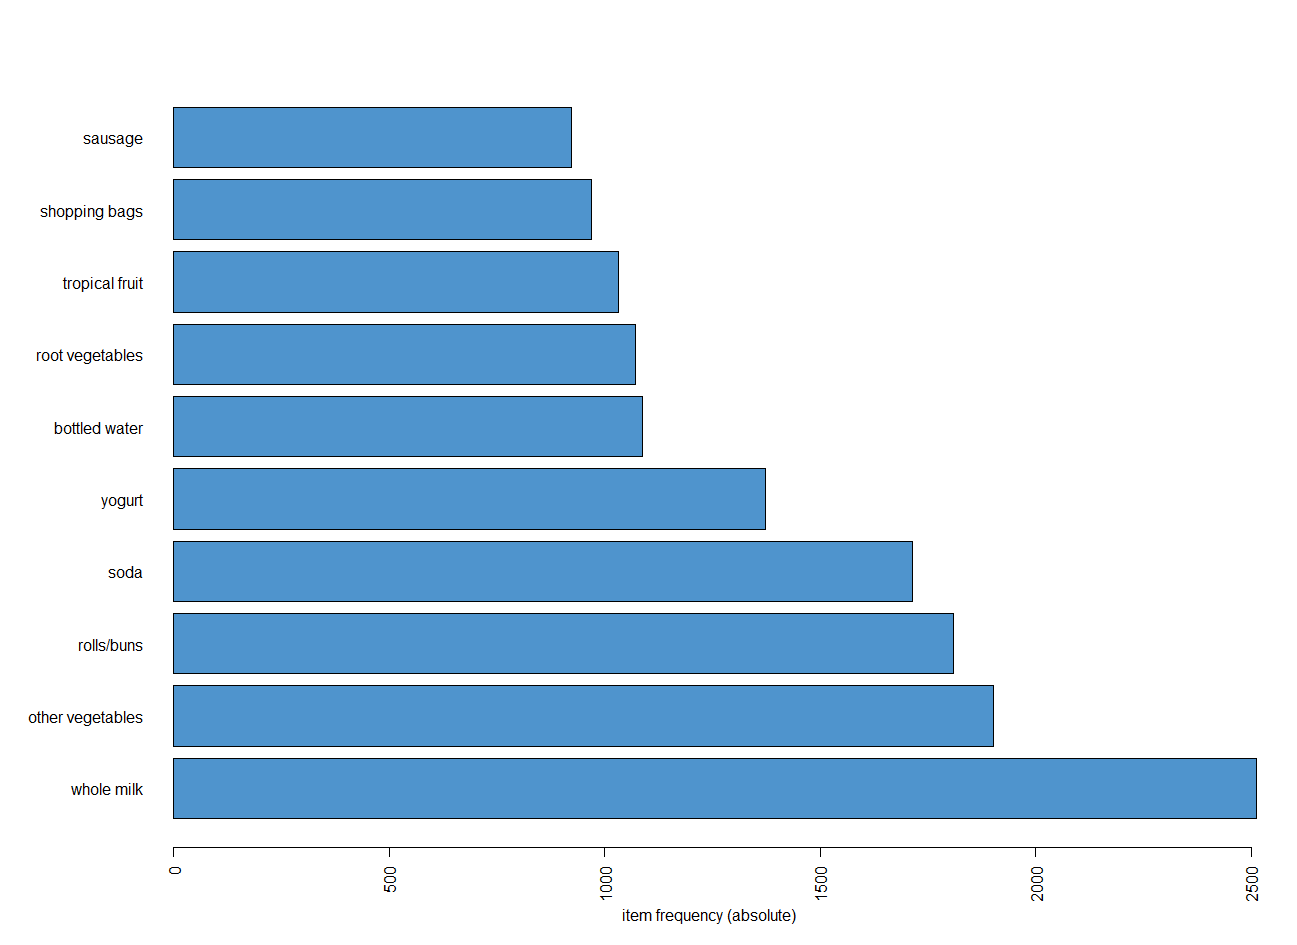
whole milk other vegetables rolls/buns soda yogurt
2513 1903 1809 1715 1372
(Other)
34055
element (itemset/transaction) length distribution:
sizes
1 2 3 4 5 6 7 8 9 10 11 12 13 14 15 16 17
2159 1643 1299 1005 855 645 545 438 350 246 182 117 78 77 55 46 29
18 19 20 21 22 23 24 26 27 28 29 32
14 14 9 11 4 6 1 1 1 1 3 1
Min. 1st Qu. Median Mean 3rd Qu. Max.
1.000 2.000 3.000 4.409 6.000 32.000
includes extended item information - examples:
labels level2 level1
1 frankfurter sausage meat and sausage
2 sausage sausage meat and sausage
3 liver loaf sausage meat and sausage
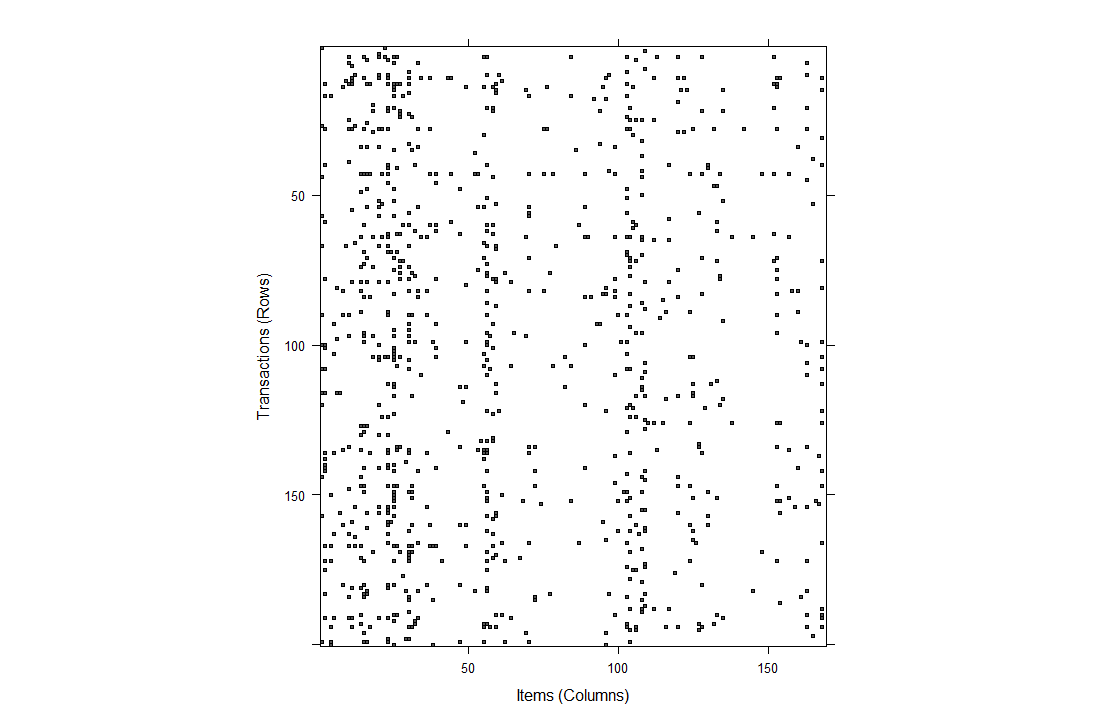
# Plotting a sample of 200 transactions
image(sample(Groceries, 200))
Najpopularniejsze produkty
itemFrequencyPlot(Groceries,type="relative",
topN=10,horiz=TRUE,col='steelblue3')
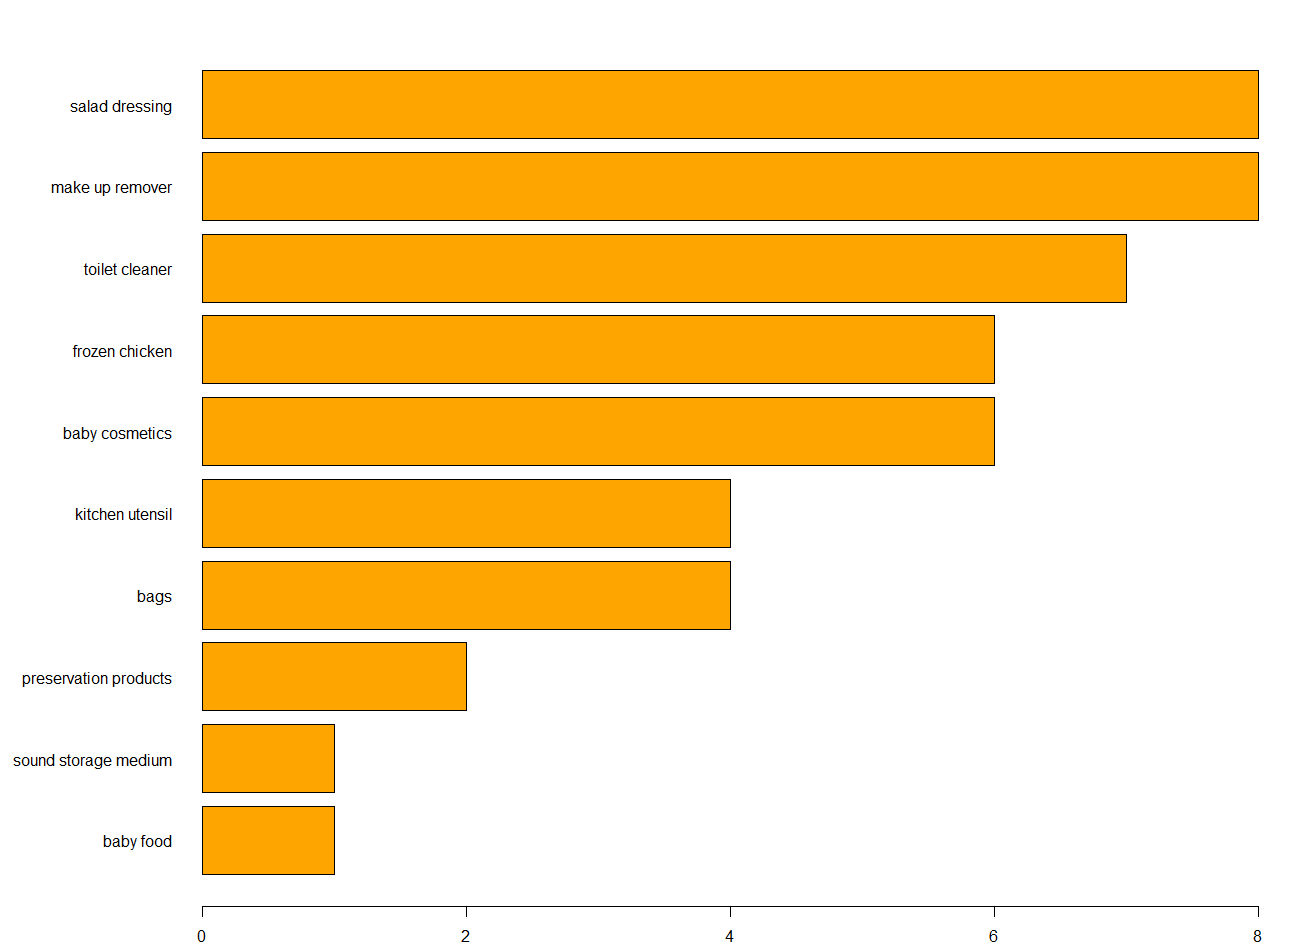
Najmniej popularne produkty
par(mar=c(2,10,2,2), mfrow=c(1,1))
barplot(sort(table(unlist(LIST(Groceries))))[1:10],
horiz = TRUE,las = 1,col='orange')
Tablice kontyngencji
# Contingency table
tbl = crossTable(Groceries)
tbl[1:4,1:4]
frankfurter sausage liver loaf ham
frankfurter 580 99 7 25
sausage 99 924 10 49
liver loaf 7 10 50 3
ham 25 49 3 256
Posortowana tablica kontyngencji
# Sorted contingency table
tbl = crossTable(Groceries, sort = TRUE)
tbl[1:4,1:4]
whole milk other vegetables rolls/buns soda
whole milk 2513 736 557 394
other vegetables 736 1903 419 322
rolls/buns 557 419 1809 377
soda 394 322 377 1715
Tablice kontyngencji
# Counts
tbl['whole milk','flour']
[1] 83
# Chi-square test
crossTable(Groceries, measure='chi')['whole milk', 'flour']
[1] 0.003595389
Tablice kontyngencji z innymi miarami
crossTable(Groceries, measure='lift',sort=T)[1:4,1:4]
whole milk other vegetables rolls/buns soda
whole milk NA 1.5136341 1.205032 1.571735
other vegetables 1.5136341 NA 1.197047 0.9703476
rolls/buns 1.2050318 1.1970465 NA 1.1951242
soda 0.8991124 0.9703476 1.195124 NA
MovieLens: Internetowy system rekomendacji filmów dla użytkowników.
Analiza koszyka zakupowego w R