ChIP-seq z Bioconductor w R
Peter Humburg
Statistician, Macquarie University
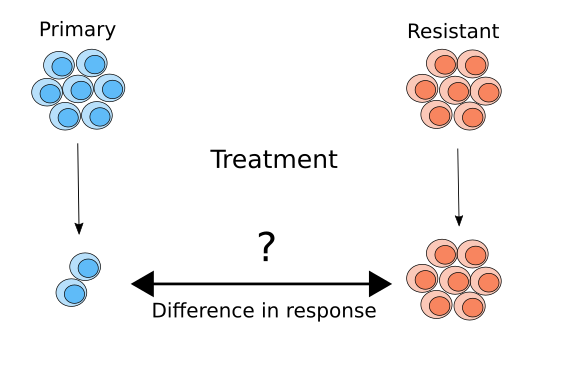
Pytania, na które chcemy odpowiedzieć:


qc_result <- ChIPQC("sample_info.csv", "hg19")
counts <- dba.count(qc_results, summits=250)
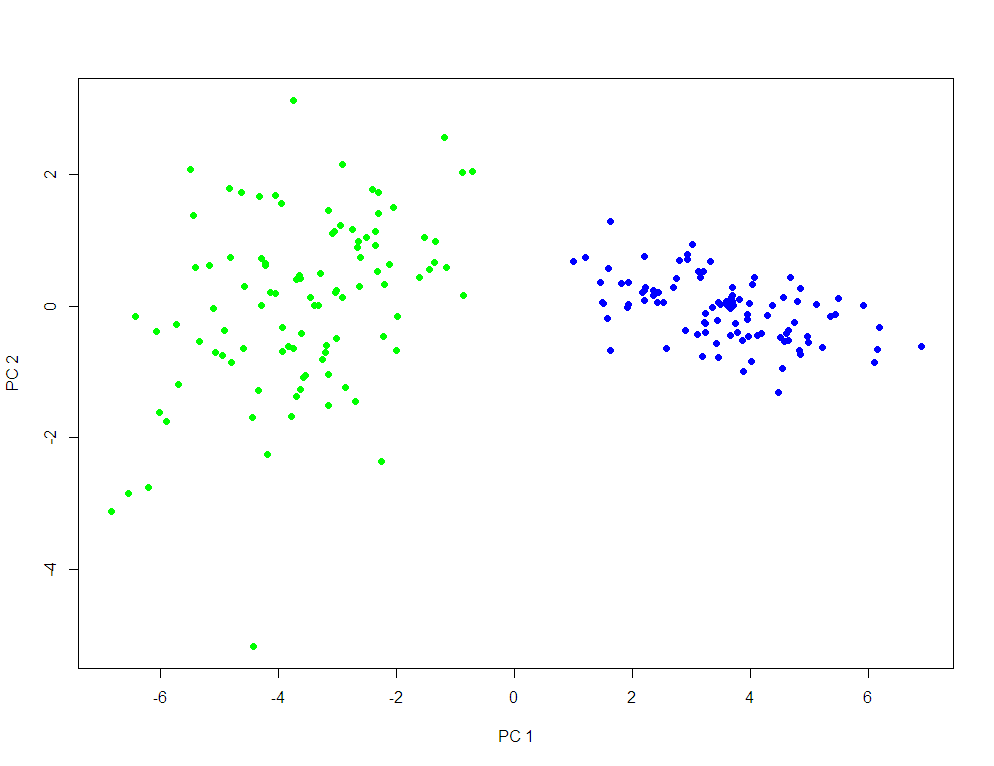
plotPrincomp(counts)
Oblicz odległość między próbkami
distance <- dist(t(coverage))
Utwórz dendrogram
dendro <- hclust(distance)
Wyświetl dendrogram
plot(dendro)
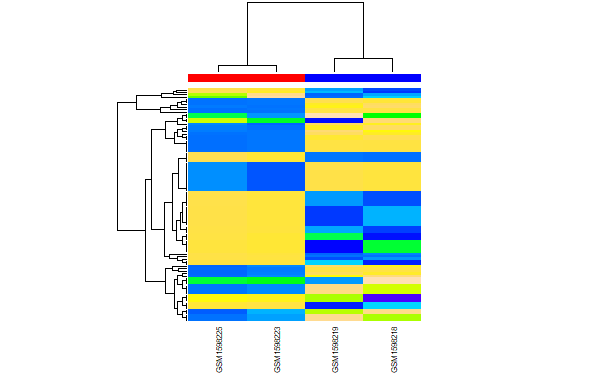
Utwórz mapę cieplną na podstawie danych pokrycia dla szczytów
dba.plotHeatmap(peaks, maxSites = peak_count, correlations = FALSE)
ChIP-seq z Bioconductor w R