Wprowadzenie do wykrywania anomalii w R
Alastair Rushworth
Data Scientist
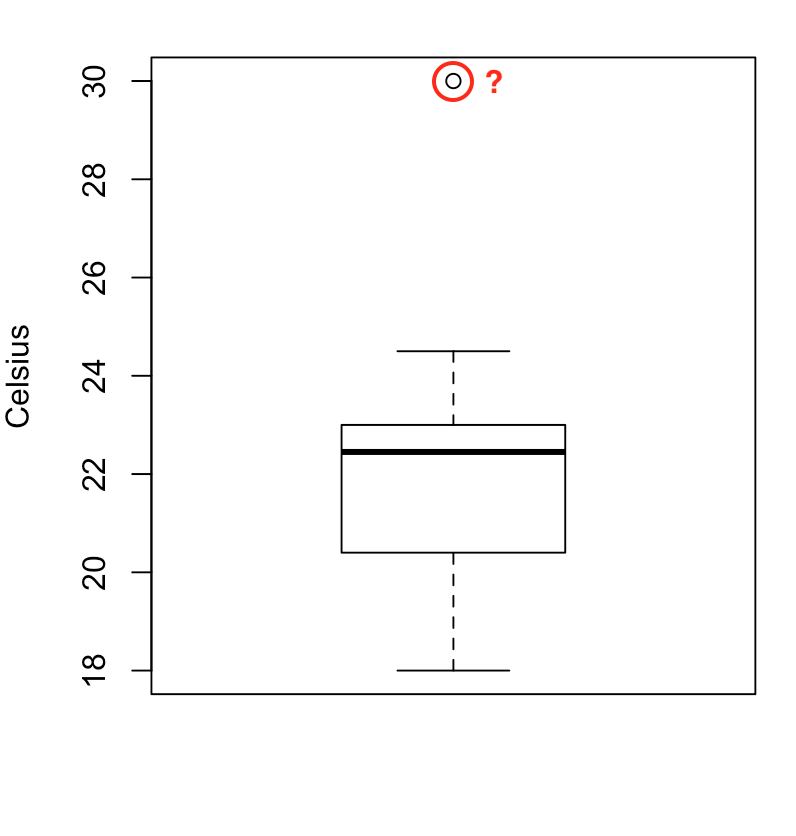
boxplot(temperature, ylab = "Celsius")
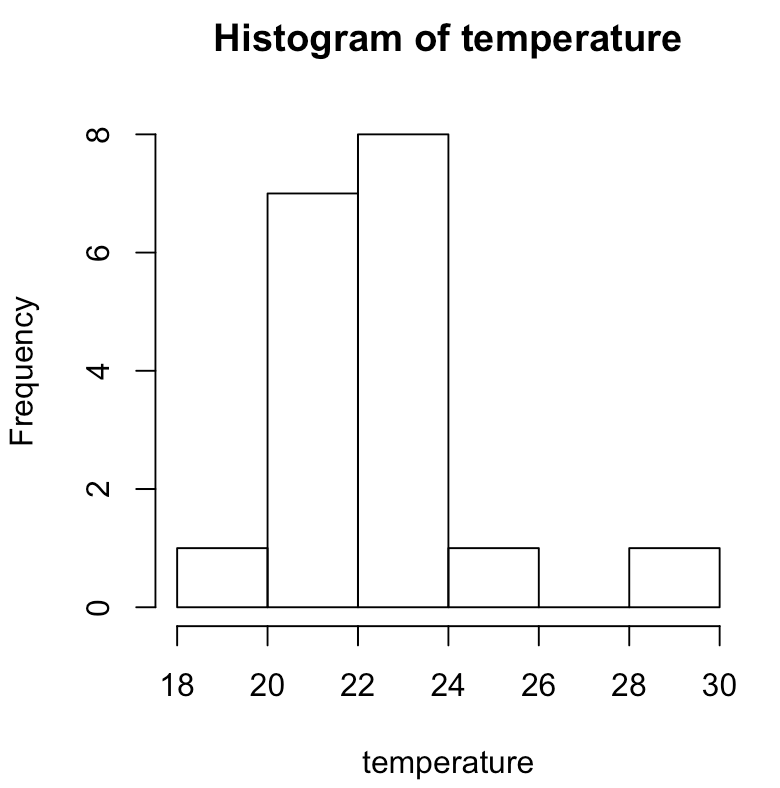
hist(temperature, breaks = 6)

Symetryczny i dzwonowy?
Użyj funkcji grubbs.test():
grubbs.test(temperature)
Grubbs test for one outlier
data: temp
G = 3.07610, U = 0.41065, p-value = 0.001796
alternative hypothesis: highest value 30 is an outlier
grubbs.test(temperature)
Grubbs test for one outlier
data: temperature
G = 3.07610, U = 0.41065, p-value = 0.001796
alternative hypothesis: highest value 30 is an outlier
p-value
Lokalizacja maksimum
which.max(weights)
5
Lokalizacja minimum
which.min(temperature)
12
Wprowadzenie do wykrywania anomalii w R