Wizualizacja danych o wyborach

Modelowanie wyborów w marketingu w R

Elea McDonnell Feit

Assistant Professor of Marketing, Drexel University

xtabs(~ trans, data = sportscar)
trans
  auto manual 
  3001   2999
xtabs(~ trans + choice, data = sportscar)
        choice
trans       0    1
  auto   1627 1374
  manual 2373  626
xtabs(choice ~ trans, data=sportscar)
trans
  auto manual 
  1374    626
Modelowanie wyborów w marketingu w R

Wizualizacja wyniku funkcji xtabs()

plot(xtabs(~ trans + choice, data = sportscar))
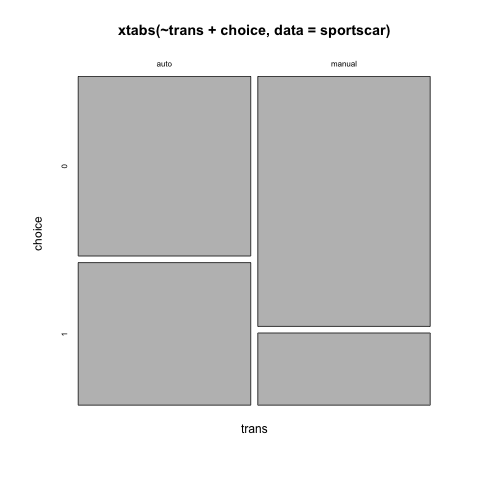
Liczba wyborów wg skrzyni biegów

Modelowanie wyborów w marketingu w R

Wybór skrzyni biegów według segmentu

plot(xtabs(~ trans + segment + choice, data = sportscar))
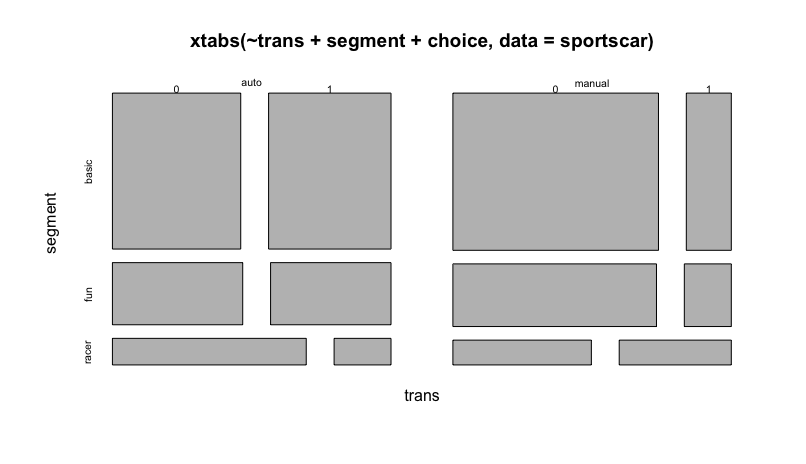
Liczba wyborów skrzyni biegów wg segmentu

Modelowanie wyborów w marketingu w R

Czas na praktykę!

Modelowanie wyborów w marketingu w R

Preparing Video For Download...