Nieliniowe modele reakcji

Building Response Models in R

Kathrin Gruber

Assistant Professor of Econometrics Erasmus University Rotterdam

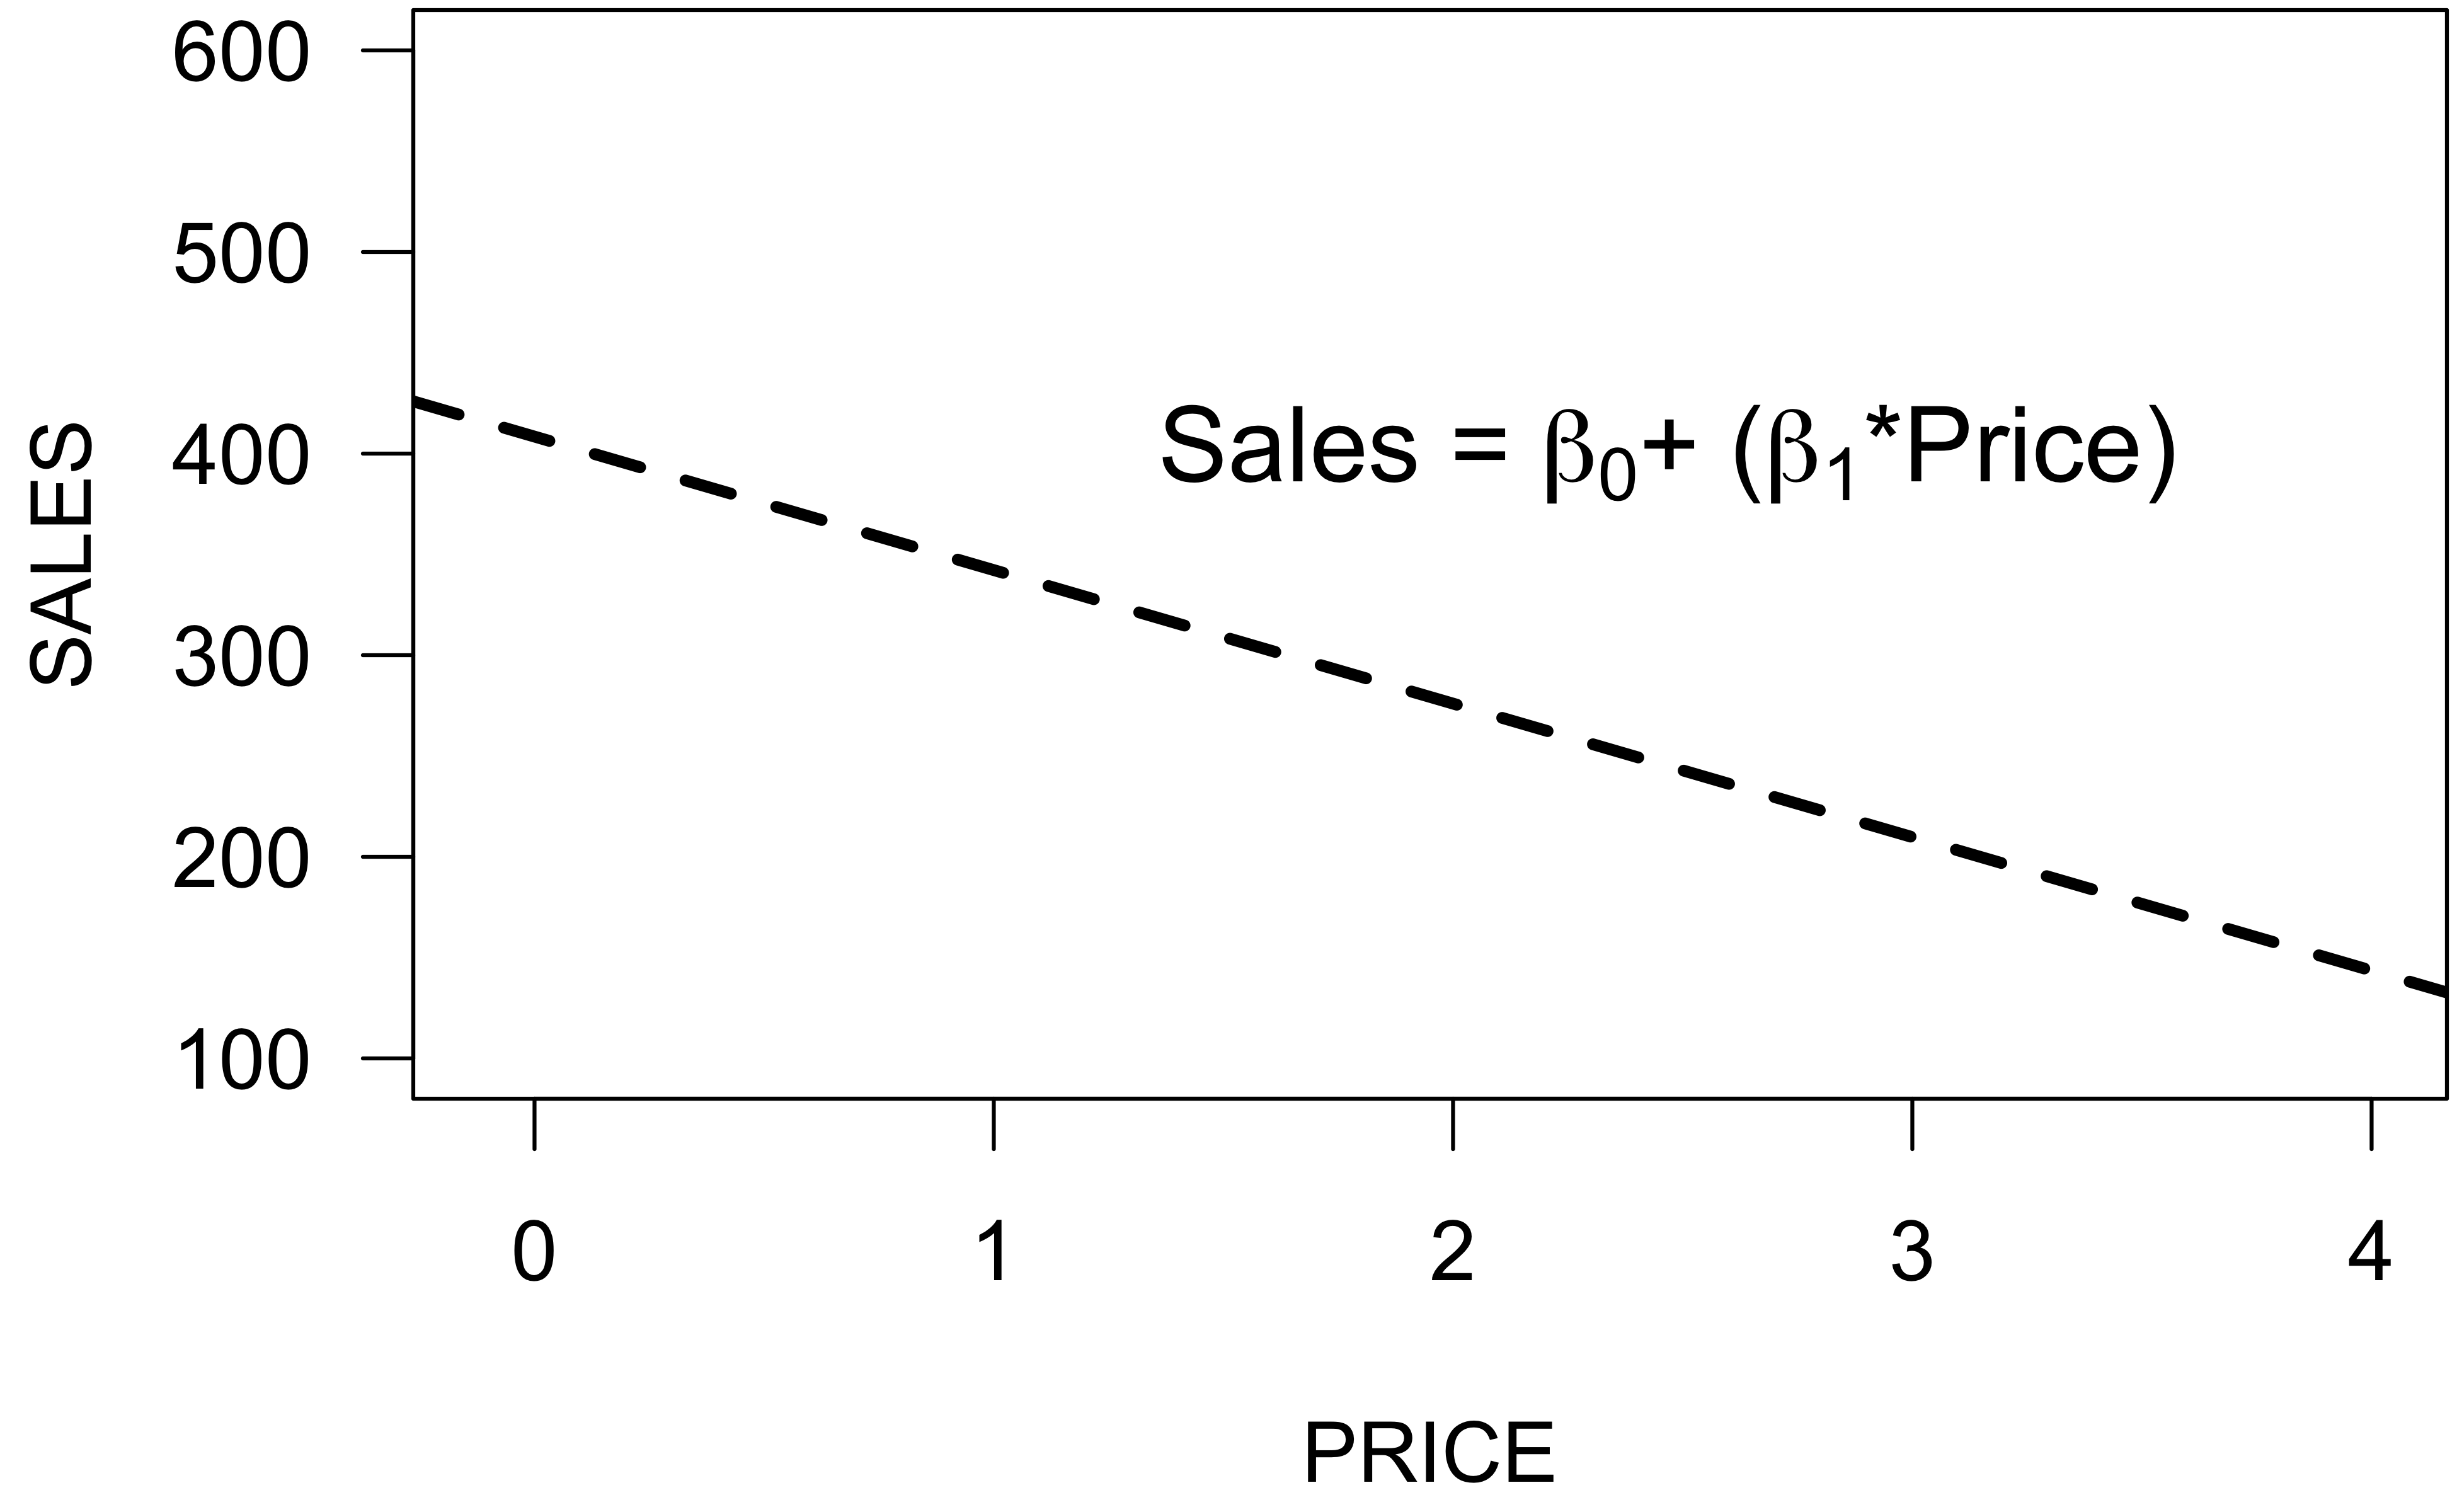
Liniowa funkcja reakcji

  • Co się dzieje, gdy PRICE wynosi zero lub jest bardzo duże?
  • A co z efektami progowymi?

Building Response Models in R

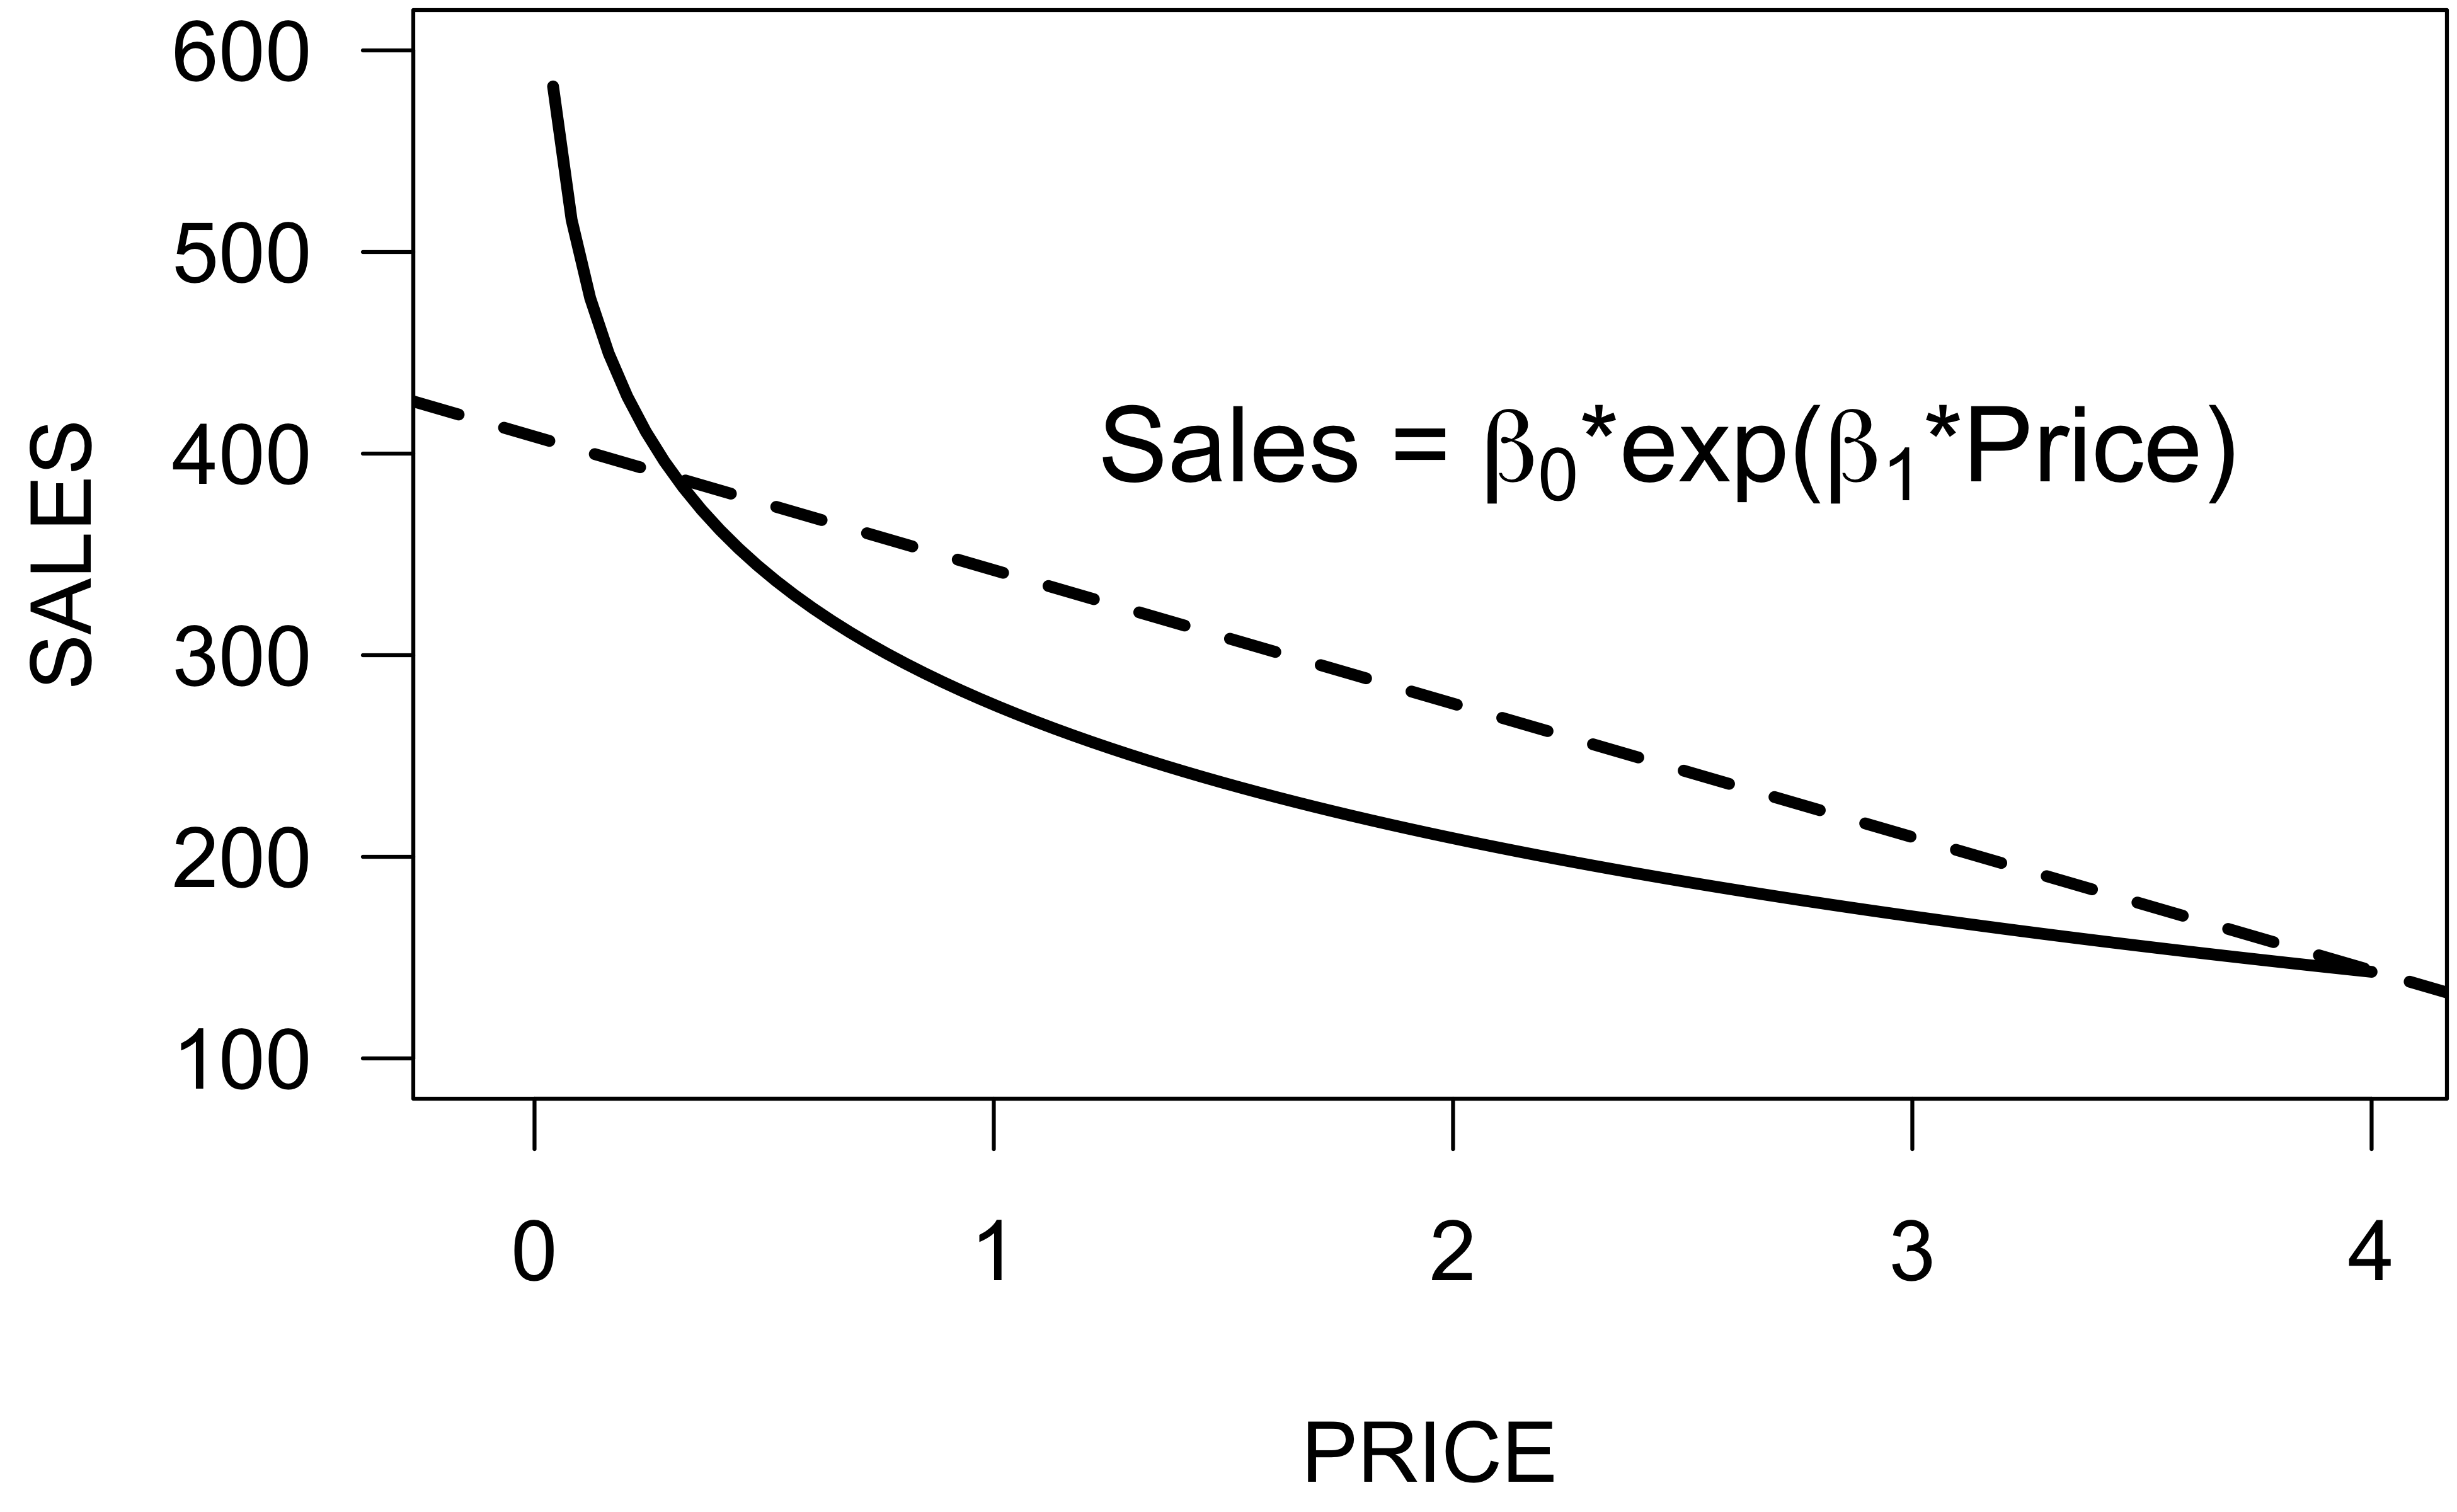
Wykładnicza funkcja reakcji

  • Zakłada stałą procentową zmianę (tempo wzrostu).
 

Building Response Models in R

Linearyzacja

  • Model nieliniowy: $\ \ \ \ \ \ \ \ \ \textsf{Sales} \ \ = \ \ \ \ \beta_0 \star \exp(\beta_1 \star \textsf{Price})$

  • Model zlinearyzowany: $\ \log (\textsf{Sales}) = \ \log (\beta_0) + (\beta_1 \star \textsf{Price})$

log.model <- lm(log(SALES) ~ PRICE, data = sales.data)

coef(log.model)
(Intercept)       PRICE 
  5.0843983  -0.6622516
  • procentowa zmiana: $\beta_1 \star 100$ = (-) 66 %
Building Response Models in R

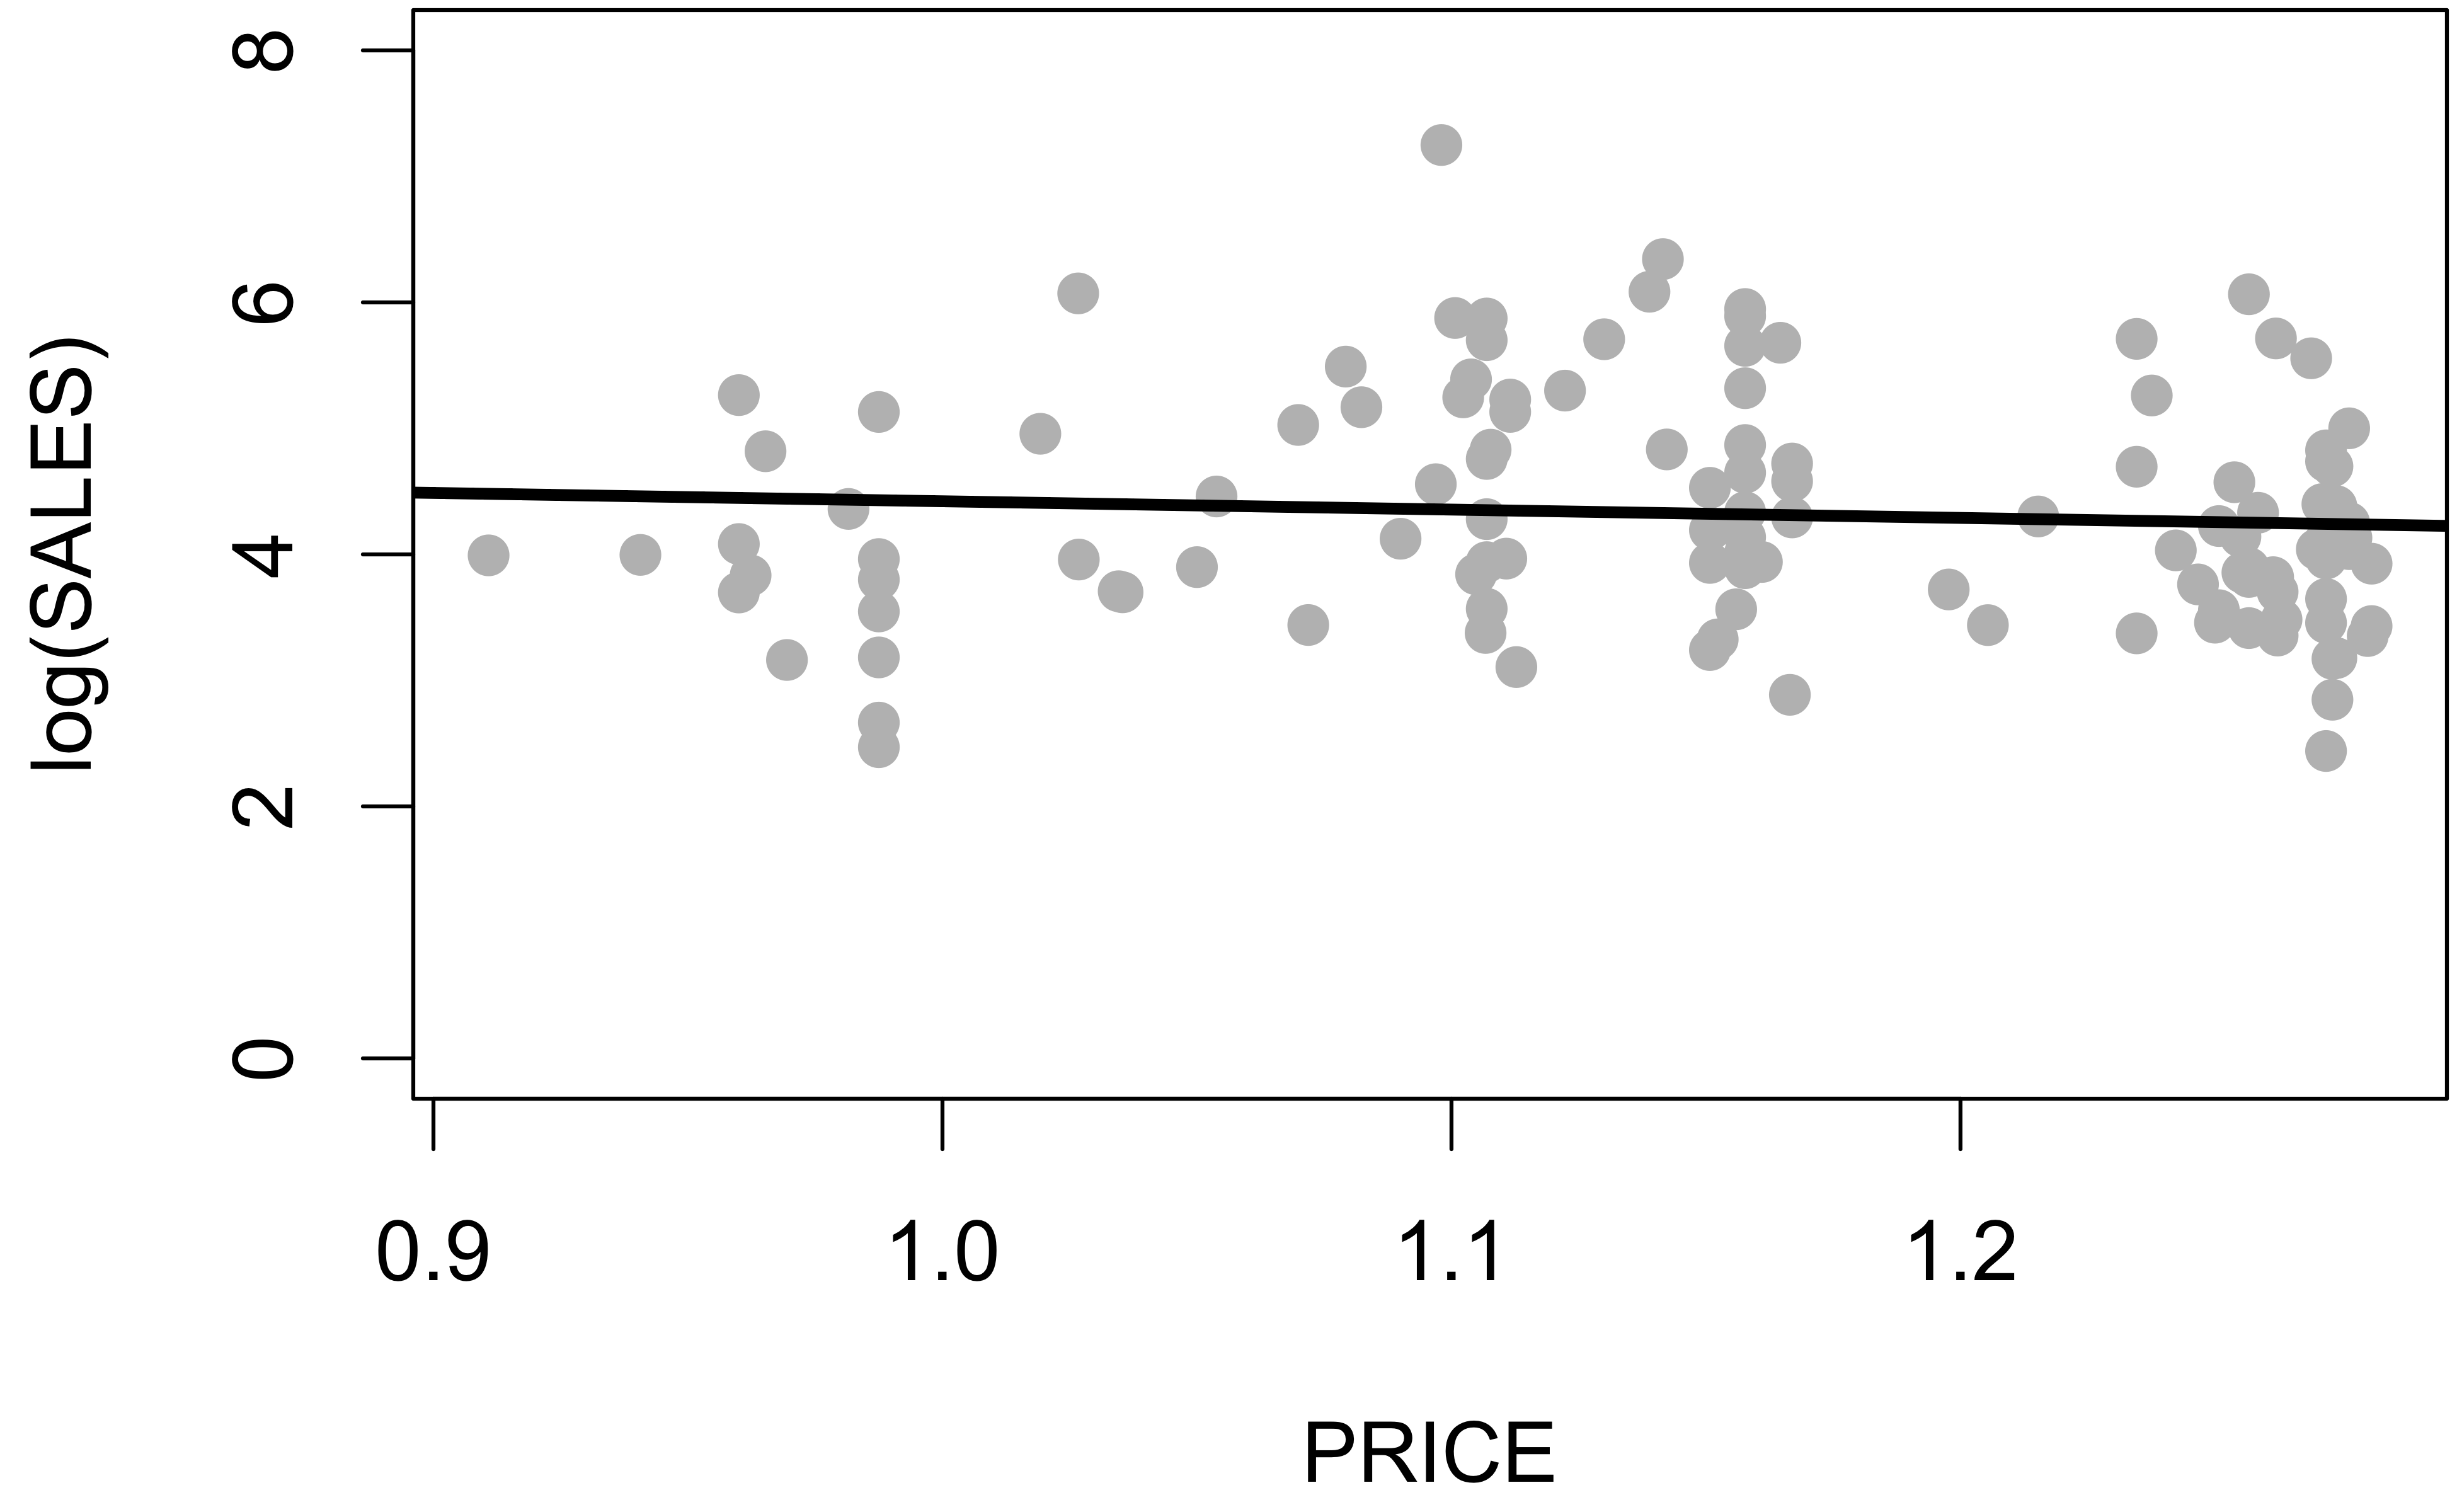
Jaka jest wartość dodana?

plot(log(SALES) ~ PRICE, data = sales.data)
log.model <- lm(log(SALES) ~ PRICE, data = sales.data)
abline(log.model)
Building Response Models in R

Czas na praktykę!

Building Response Models in R

Preparing Video For Download...