Manipulacja danymi w Julii
Katerina Zahradova
Instructor
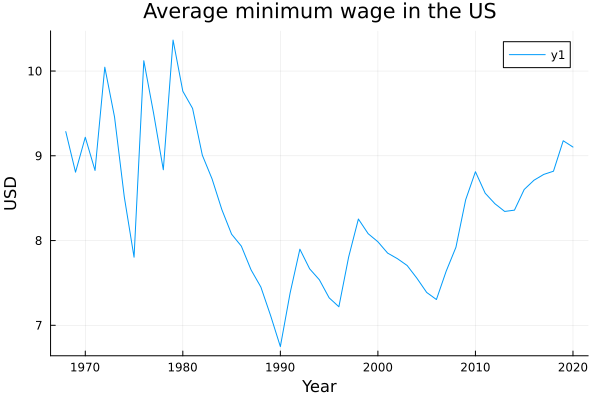
Row year mean_min_wage_2020_dollars
Int64 Float64
________________________________
1 1968 9.28529
2 1969 8.80667
3 1970 9.21882
4 1971 8.82686
5 1972 10.0457
...

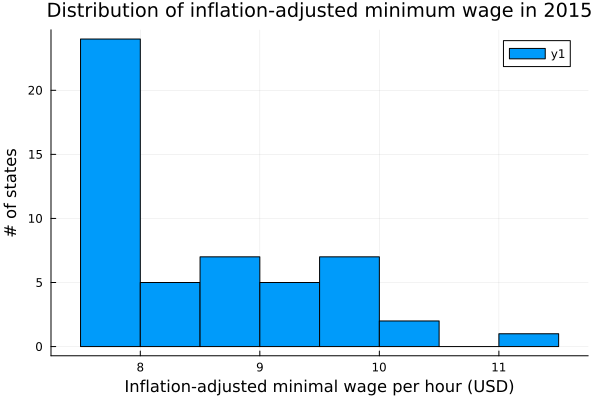
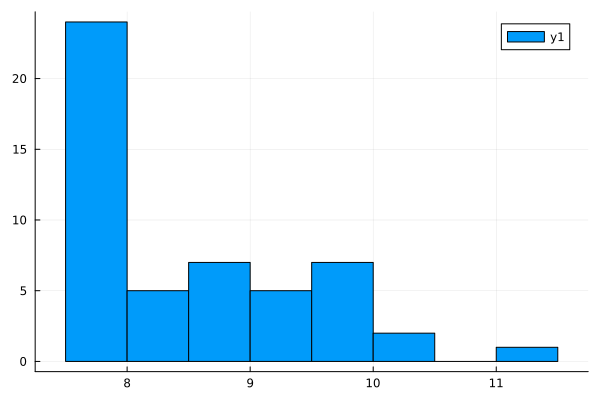
# Make a histogram with default bins
wages_2015 = filter(wages.year == 2015, wages)
histogram(wages_2015.eff_min_wage_2020_dollars)
# Specifying the number of bins
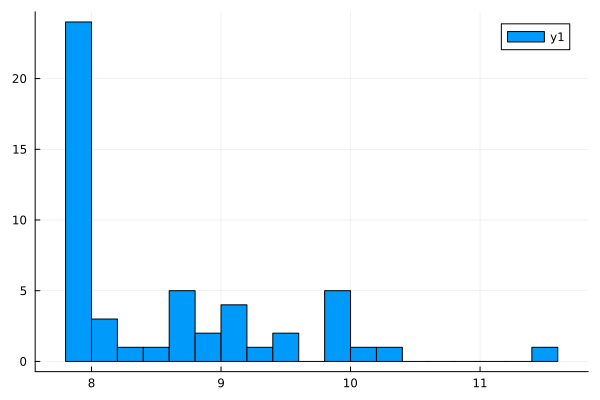
wages_2015 = filter(wages.year == 2015, wages)
histogram(wages_2015.eff_min_wage_2020_dollars,
bins = 25)
# Make histogram wages_2015 = filter(wages.year == 2015, wages) histogram(wages_2015.eff_min_wage_2020_dollars)# Include x label xlabel!("Inflation-adjusted minimal wage per hour (USD)")# Include y label ylabel!("# of states")# Make title title!("Distribution of inflation-adjusted minimum wage in 2015")

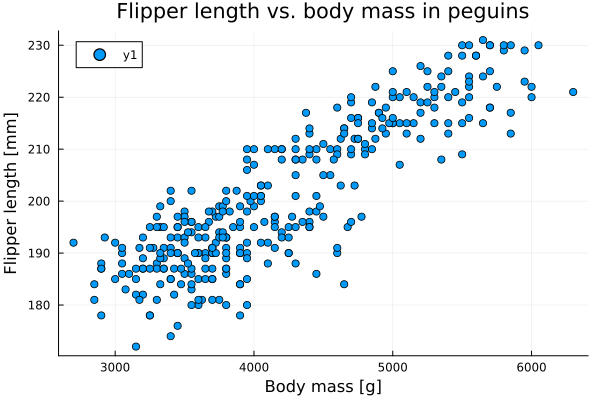
# Scatter plot
scatter(penguins.body_mass_g,
penguins.flipper_length_mm)
# Labels
xlabel!("Body mass [g]")
ylabel!("Flipper length [mm]")
title!("Flipper length vs.
body mass in peguins")

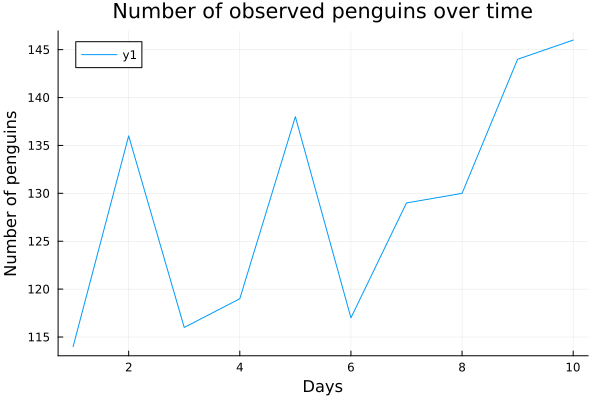
# Number of Adelie penguins over time
plot(observations.days,
observations.adelie)
# Labels
xlabel!("Days")
ylabel!("Number of penguins")
title!("Number of observed
penguins over time")

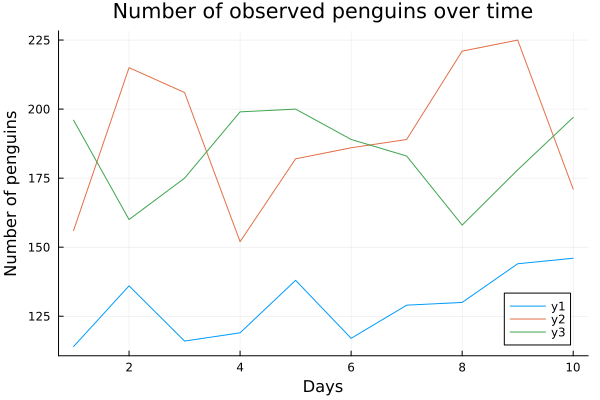
# Plot the first line plot(observations.day, observations.adelie)# Adding and modifying with new lines plot!(observations.day, observations.chinstrap) plot!(observations.day, observations.gentoo)# Labels xlabel!("Days") ylabel!("Number of penguins") title!("Number of observed penguins over time")

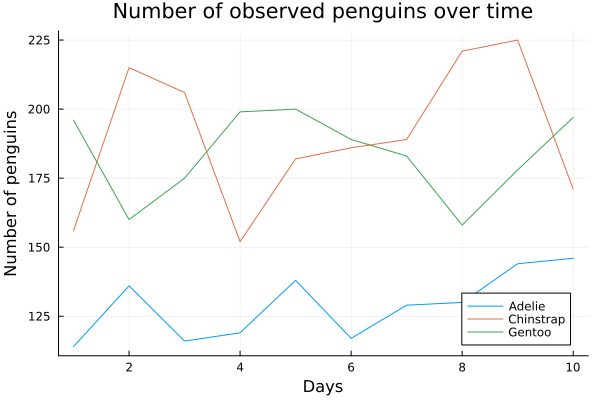
# Make a plot
plot(observations.day, observatations.adelie,
label = "Adelie" )
plot!(observations.day, observations.chinstrap,
label = "Chinstrap")
plot!(observations.day, observations.gentoo,
label = "Gentoo")
# Labels
xlabel!("Days")
ylabel!("Number of penguins")
title!("Number of observed penguins over time")

Typy wykresów:
Histogram – rozkład zmiennej numerycznej
histogram(df.n1, label = "n1")
Wykres punktowy – zależność między dwiema zmiennymi numerycznymi
scatter(df.x, df.y, label = "y")
Wykres liniowy – zmiany zmiennej numerycznej w czasie
plot(df.x, df.y, label = "y")
Dodawanie kolejnej linii do wykresu:
histogram!(df.n2, label = "n2")scatter!(df.x2, df.y2, label = "y2")plot!(df.x2, df.y2, label = "y2")Opisy osi i tytuł:
xlabel!("Text of your x label")ylabel!("Text of your y label")title!("Text of your title")Manipulacja danymi w Julii