自定义

Python 中级

Hugo Bowne-Anderson

Data Scientist at DataCamp

数据可视化

  • 许多选项

    • 不同图表类型

    • 多种自定义

  • 选择取决于

    • 数据

    • 想要讲述的故事

Python 中级

基础绘图

population.py

import matplotlib.pyplot as plt
year = [1950, 1951, 1952, ..., 2100]
pop = [2.538, 2.57, 2.62, ..., 10.85]

plt.plot(year, pop)

plt.show()

ch1_3_slides.012.png

Python 中级

轴标签

population.py

import matplotlib.pyplot as plt
year = [1950, 1951, 1952, ..., 2100] 
pop = [2.538, 2.57, 2.62, ..., 10.85]

plt.plot(year, pop)

plt.xlabel('Year') plt.ylabel('Population')
plt.show()

ch1_3_slides.012.png

Python 中级

轴标签

population.py

import matplotlib.pyplot as plt
year = [1950, 1951, 1952, ..., 2100] 
pop = [2.538, 2.57, 2.62, ..., 10.85]

plt.plot(year, pop)

plt.xlabel('Year') plt.ylabel('Population')
plt.show()

ch1_3_slides.014.png

Python 中级

标题

population.py

import matplotlib.pyplot as plt
year = [1950, 1951, 1952, ..., 2100] 
pop = [2.538, 2.57, 2.62, ..., 10.85]

plt.plot(year, pop)

plt.xlabel('Year') plt.ylabel('Population')
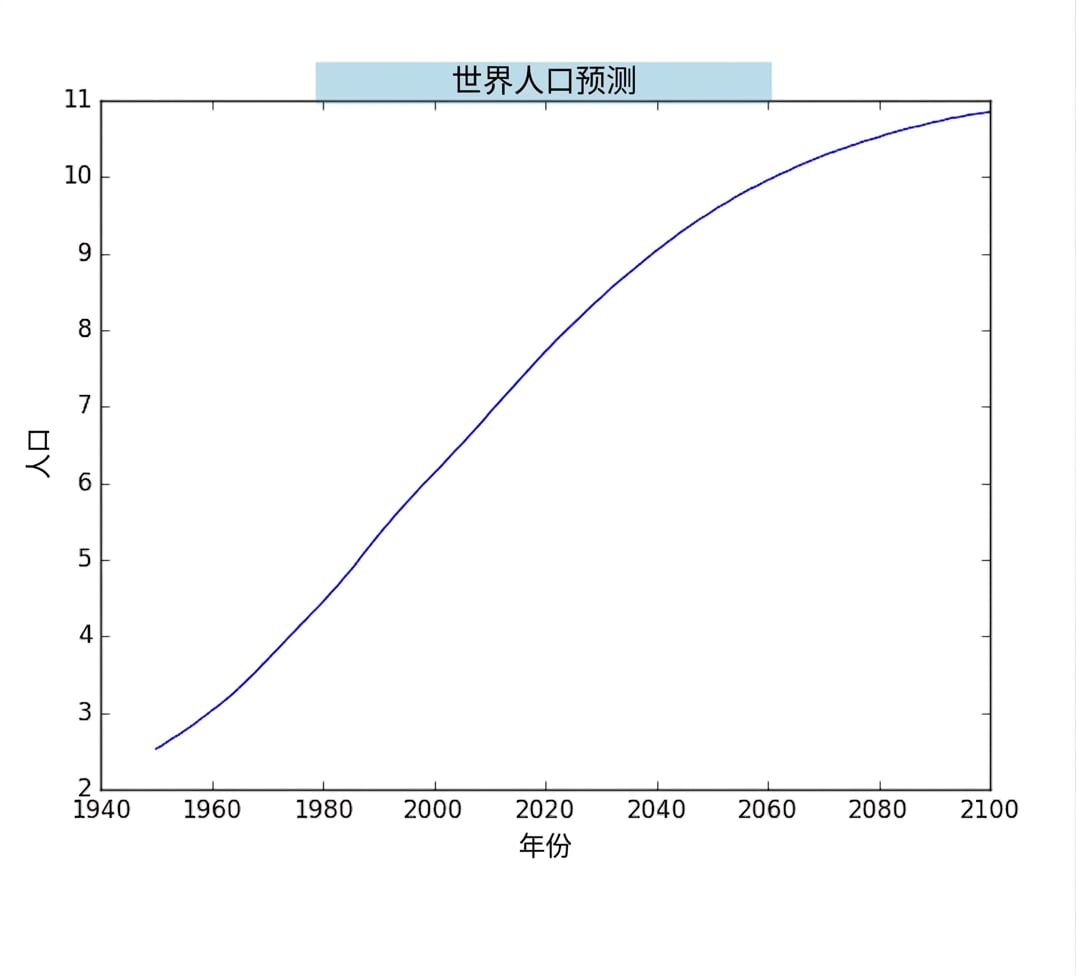
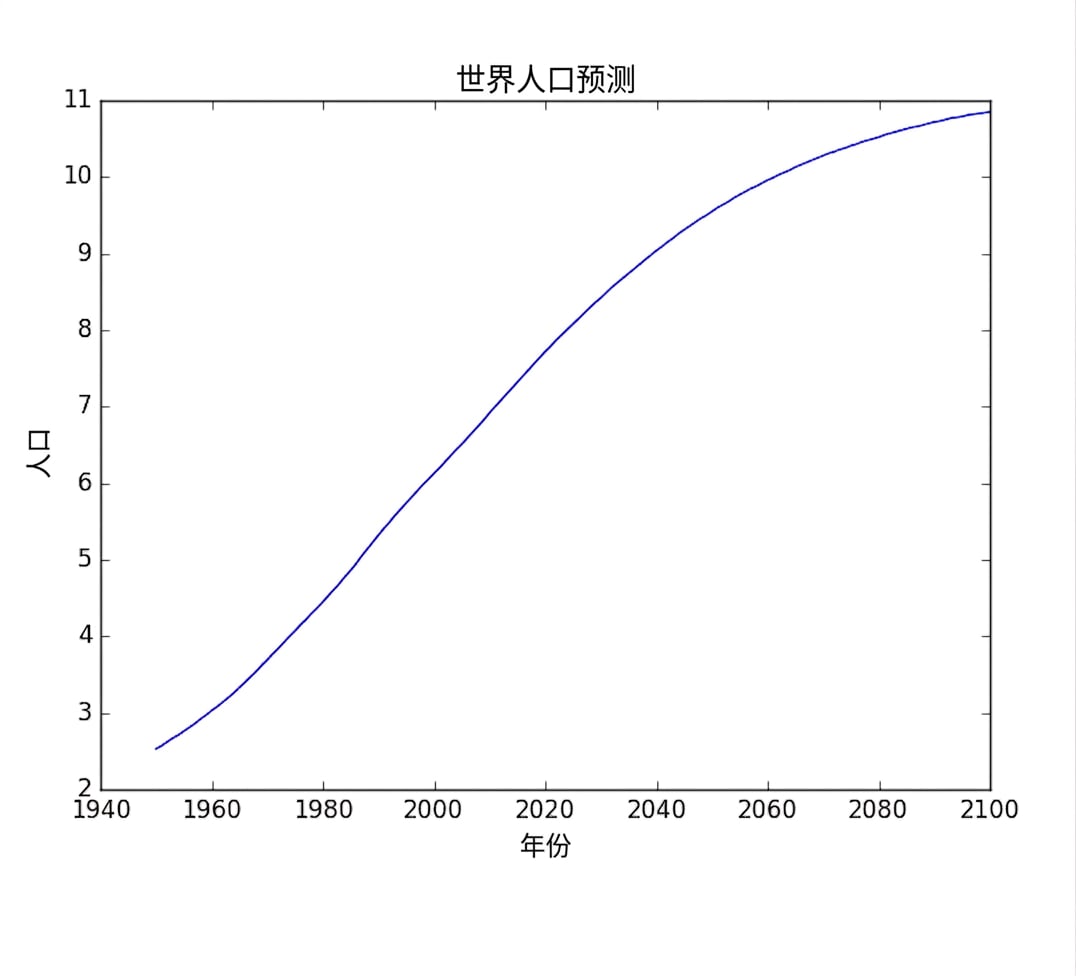
plt.title('World Population Projections')
plt.show()

ch1_3_slides.015.png

Python 中级

标题

population.py

import matplotlib.pyplot as plt
year = [1950, 1951, 1952, ..., 2100] 
pop = [2.538, 2.57, 2.62, ..., 10.85]

plt.plot(year, pop)

plt.xlabel('Year') plt.ylabel('Population')
plt.title('World Population Projections')
plt.show()

ch1_3_slides.017.png

Python 中级

刻度

population.py

import matplotlib.pyplot as plt
year = [1950, 1951, 1952, ..., 2100] 
pop = [2.538, 2.57, 2.62, ..., 10.85]

plt.plot(year, pop)

plt.xlabel('Year') plt.ylabel('Population')
plt.title('World Population Projections')
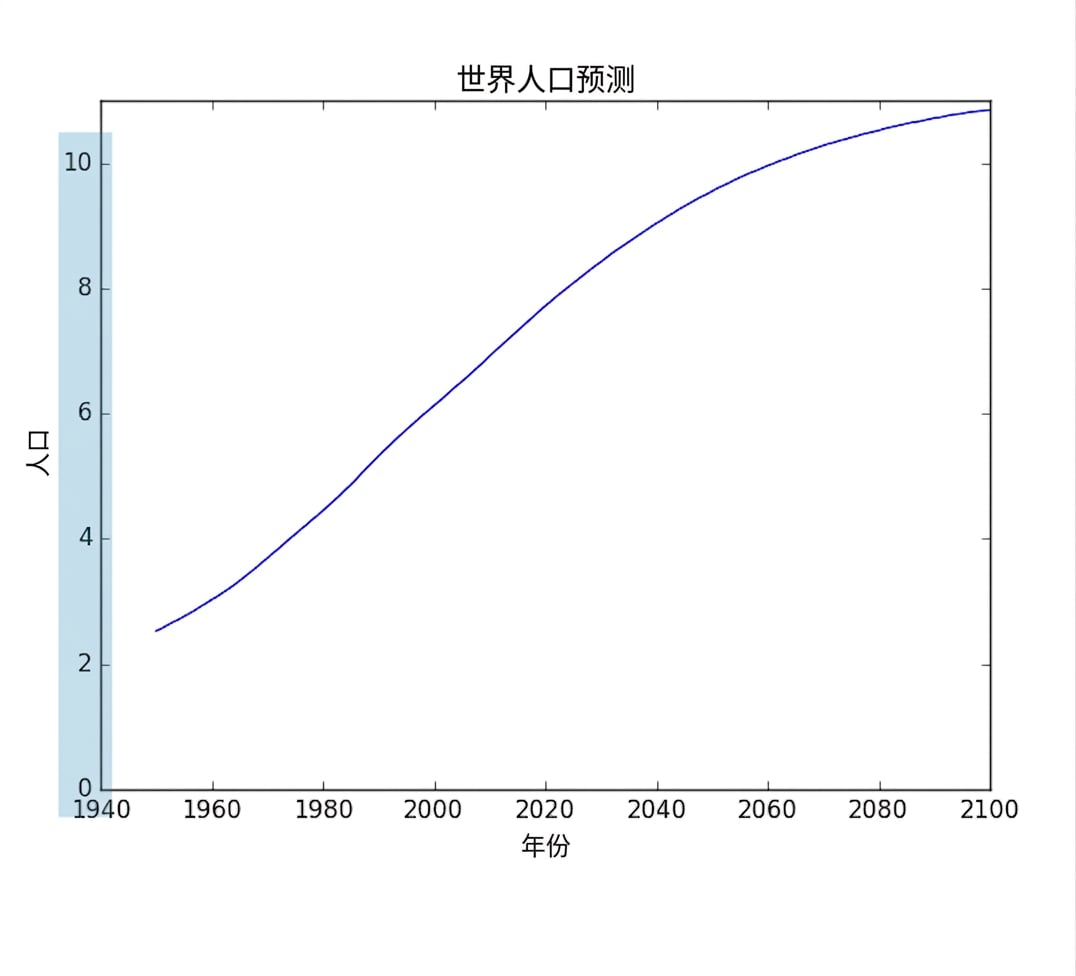
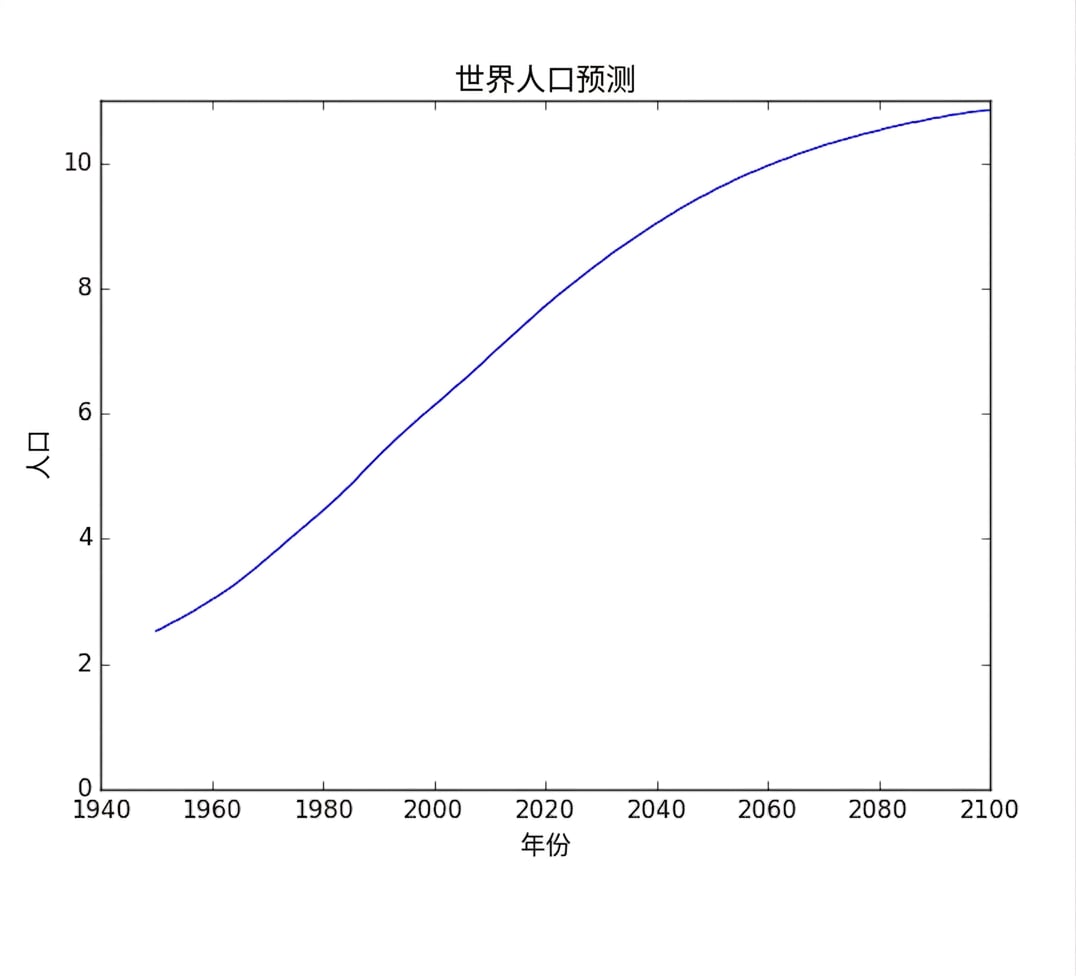
plt.yticks([0, 2, 4, 6, 8, 10])
plt.show()

ch1_3_slides.019.png

Python 中级

刻度

population.py

import matplotlib.pyplot as plt
year = [1950, 1951, 1952, ..., 2100] 
pop = [2.538, 2.57, 2.62, ..., 10.85]

plt.plot(year, pop)

plt.xlabel('Year') plt.ylabel('Population')
plt.title('World Population Projections')
plt.yticks([0, 2, 4, 6, 8, 10])
plt.show()

ch1_3_slides.020.png

Python 中级

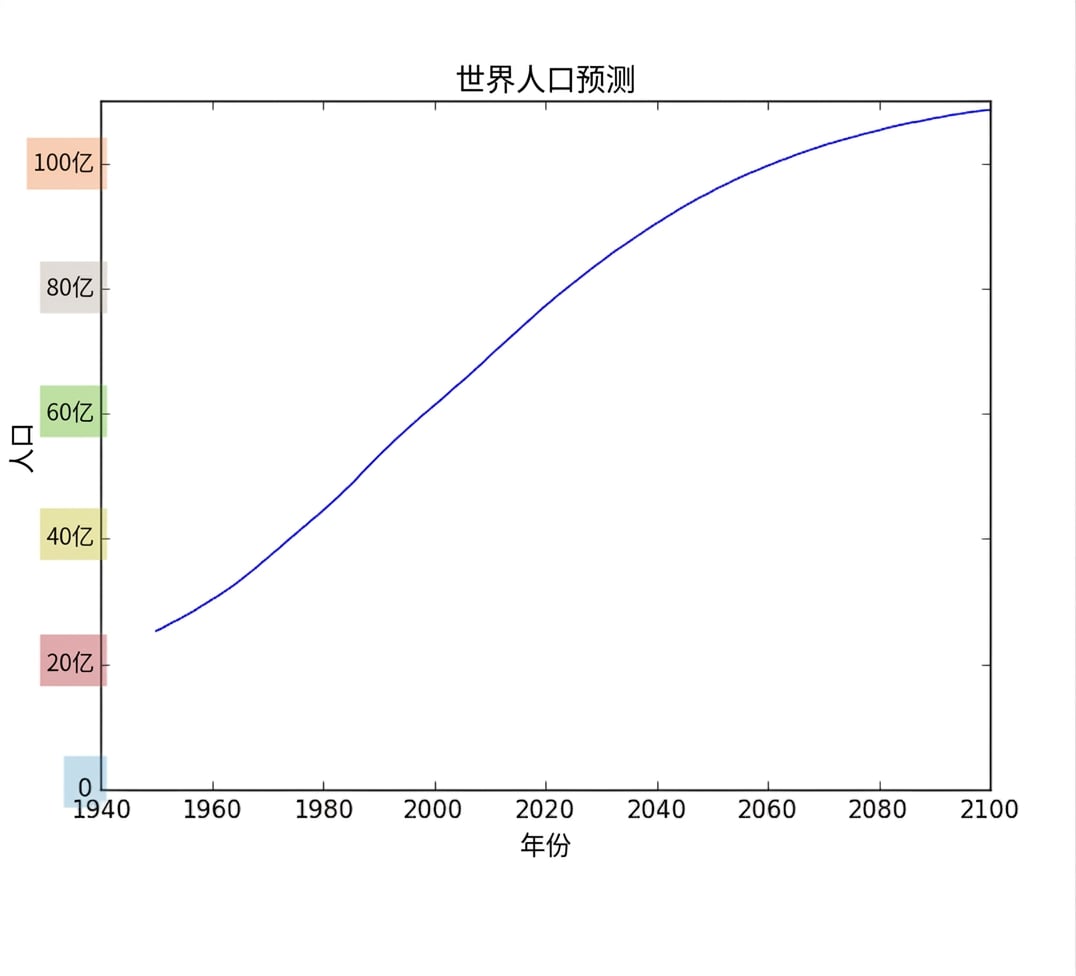
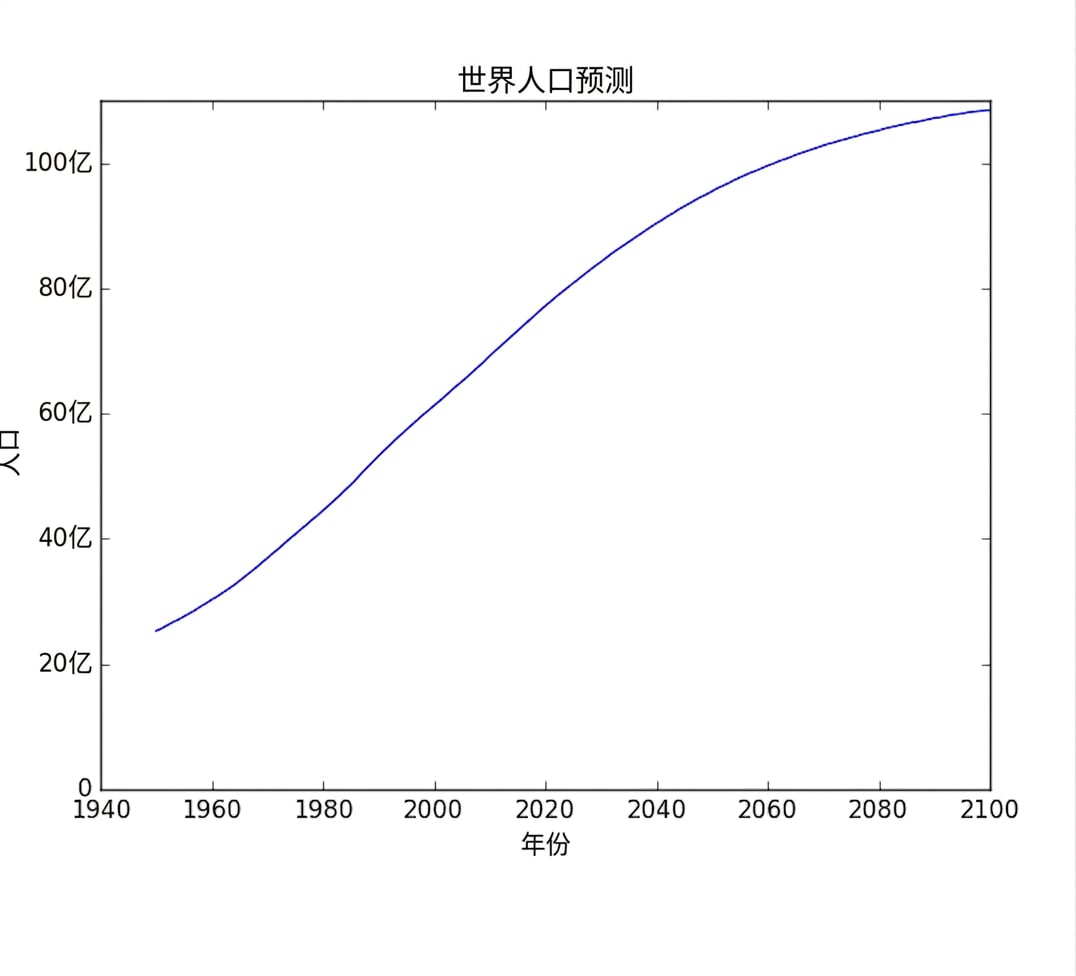
刻度(2)

population.py

import matplotlib.pyplot as plt
year = [1950, 1951, 1952, ..., 2100] 
pop = [2.538, 2.57, 2.62, ..., 10.85]

plt.plot(year, pop)

plt.xlabel('Year') plt.ylabel('Population')
plt.title('World Population Projections')
plt.yticks([0, 2, 4, 6, 8, 10],
['0', '2B', '4B', '6B', '8B', '10B'])
plt.show()

ch1_3_slides.021.png

Python 中级

刻度(2)

population.py

import matplotlib.pyplot as plt
year = [1950, 1951, 1952, ..., 2100] 
pop = [2.538, 2.57, 2.62, ..., 10.85]

plt.plot(year, pop)

plt.xlabel('Year') plt.ylabel('Population')
plt.title('World Population Projections')
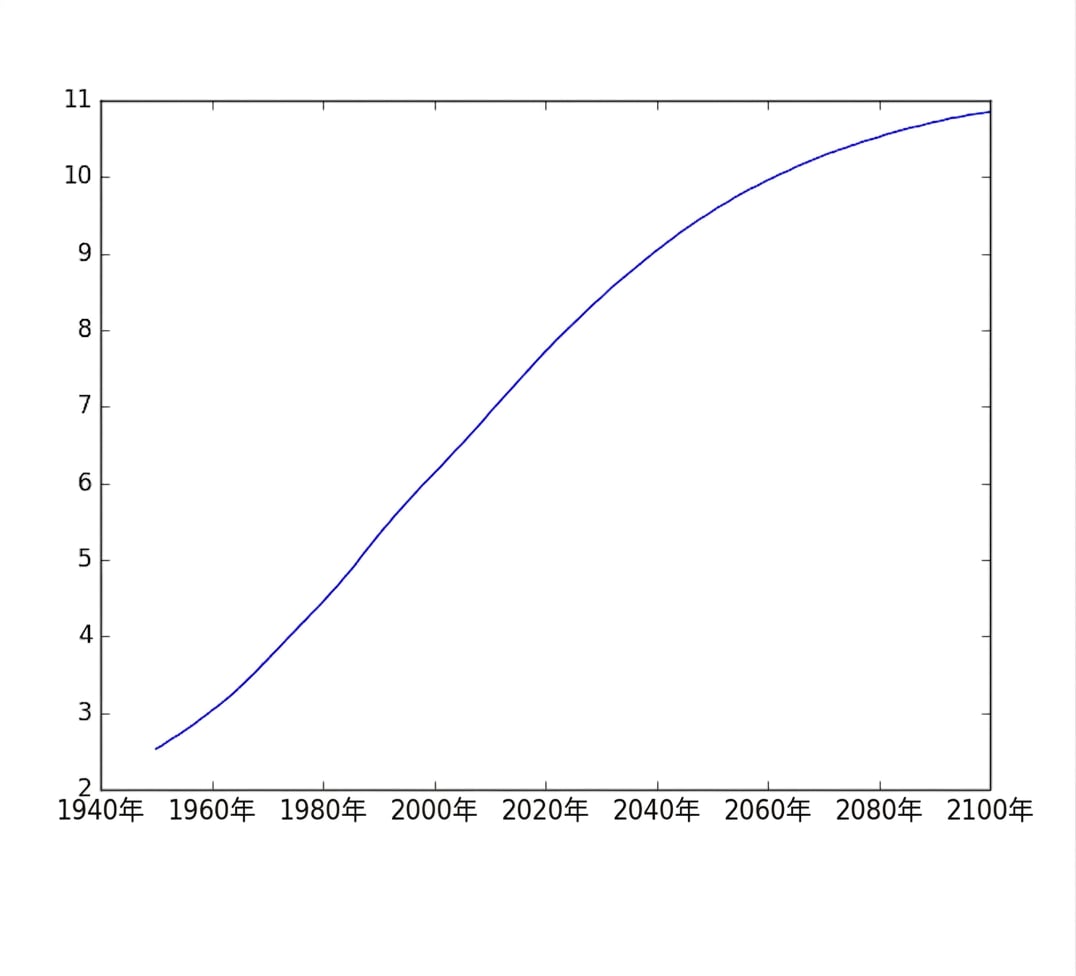
plt.yticks([0, 2, 4, 6, 8, 10],
['0', '2B', '4B', '6B', '8B', '10B'])
plt.show()
ch1_3_slides.027.png

Python 中级

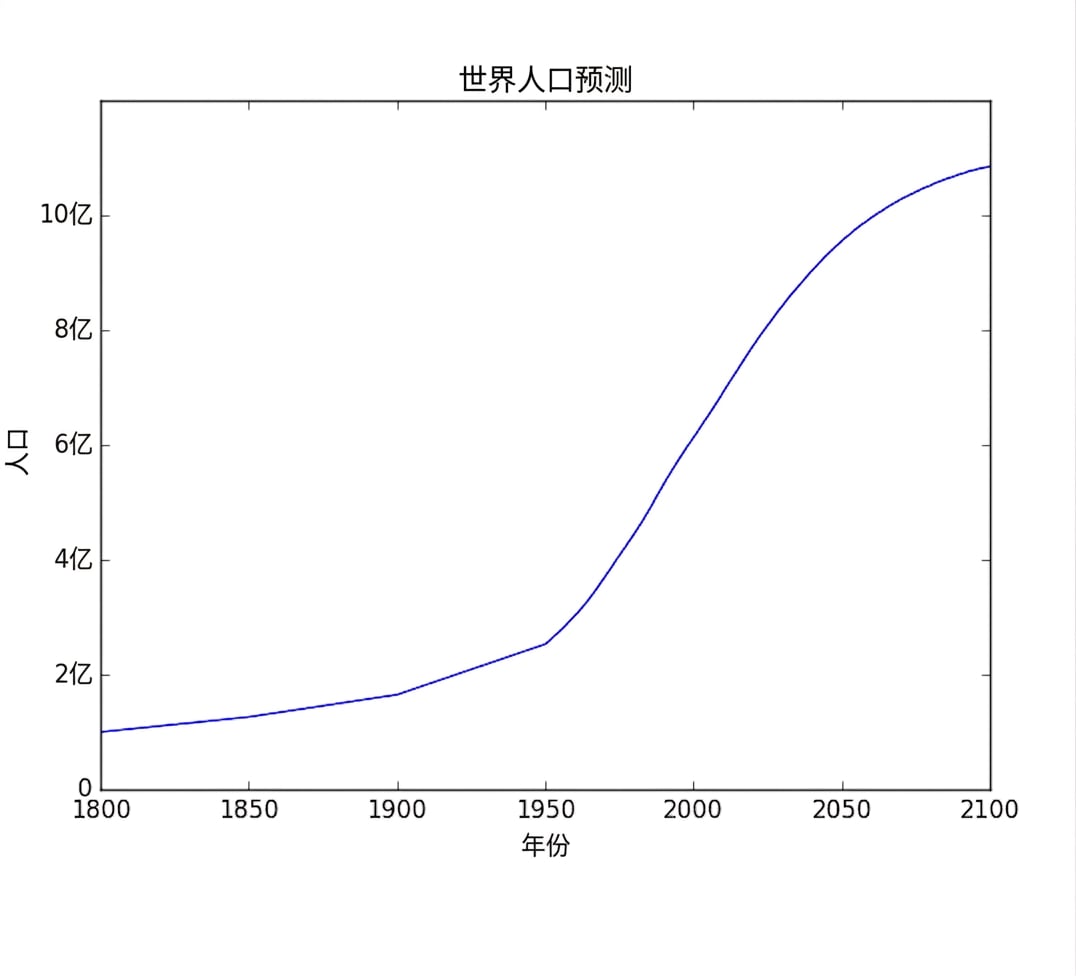
添加历史数据

population.py

import matplotlib.pyplot as plt
year = [1950, 1951, 1952, ..., 2100] 
pop = [2.538, 2.57, 2.62, ..., 10.85]

# Add more data year = [1800, 1850, 1900] + year pop = [1.0, 1.262, 1.650] + pop
plt.plot(year, pop)
plt.xlabel('Year') plt.ylabel('Population')
plt.title('World Population Projections')
plt.yticks([0, 2, 4, 6, 8, 10],
['0', '2B', '4B', '6B', '8B', '10B'])
plt.show()
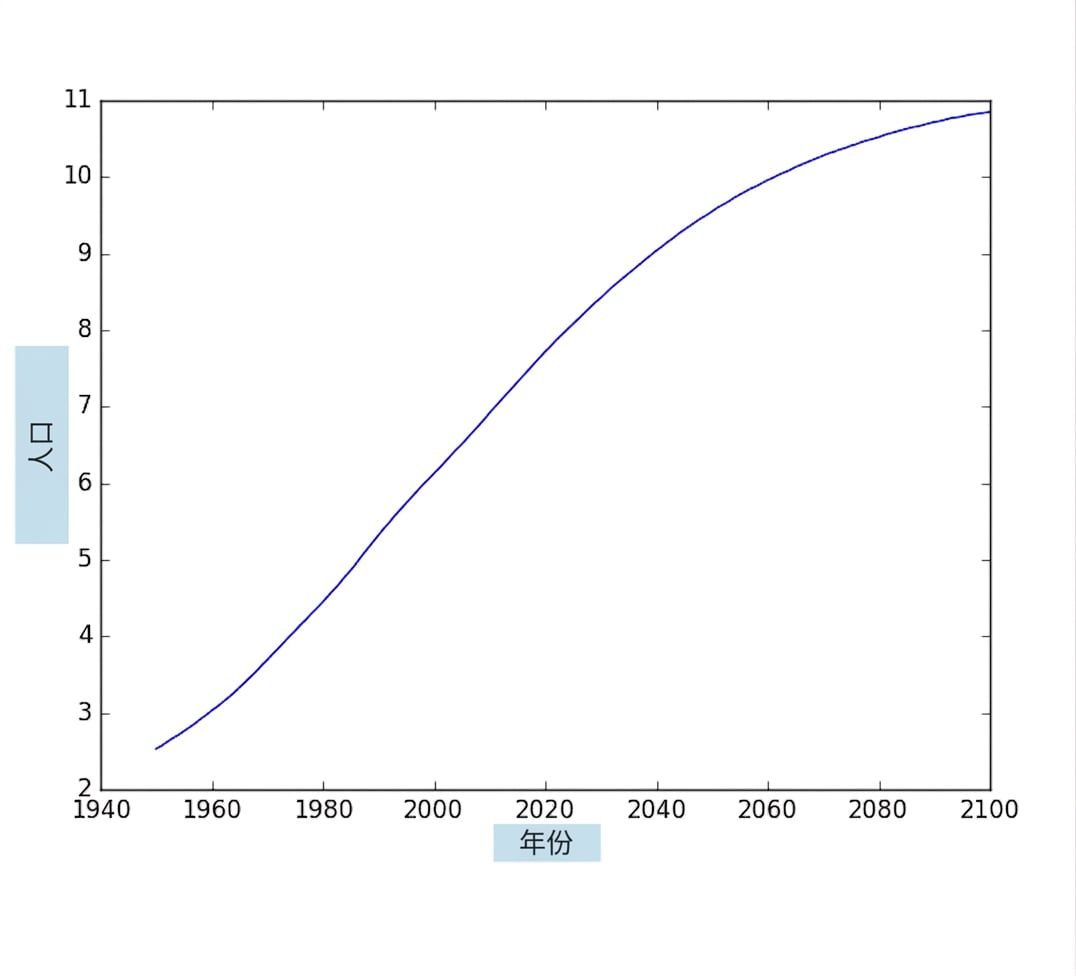
ch1_3_slides.028.png

Python 中级

添加历史数据

population.py

import matplotlib.pyplot as plt
year = [1950, 1951, 1952, ..., 2100] 
pop = [2.538, 2.57, 2.62, ..., 10.85]

# Add more data year = [1800, 1850, 1900] + year pop = [1.0, 1.262, 1.650] + pop
plt.plot(year, pop)
plt.xlabel('Year') plt.ylabel('Population')
plt.title('World Population Projections')
plt.yticks([0, 2, 4, 6, 8, 10],
['0', '2B', '4B', '6B', '8B', '10B'])
plt.show()
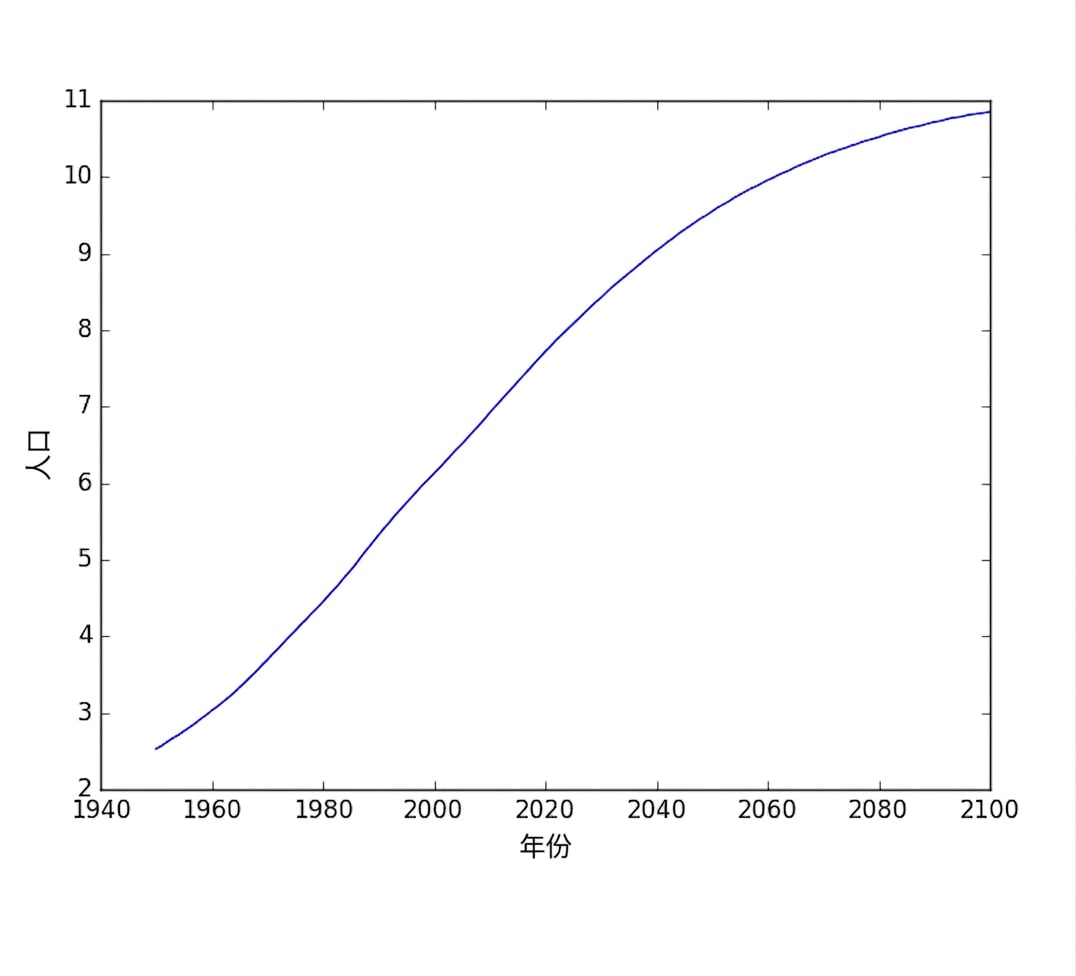
ch1_3_slides.030.png

Python 中级

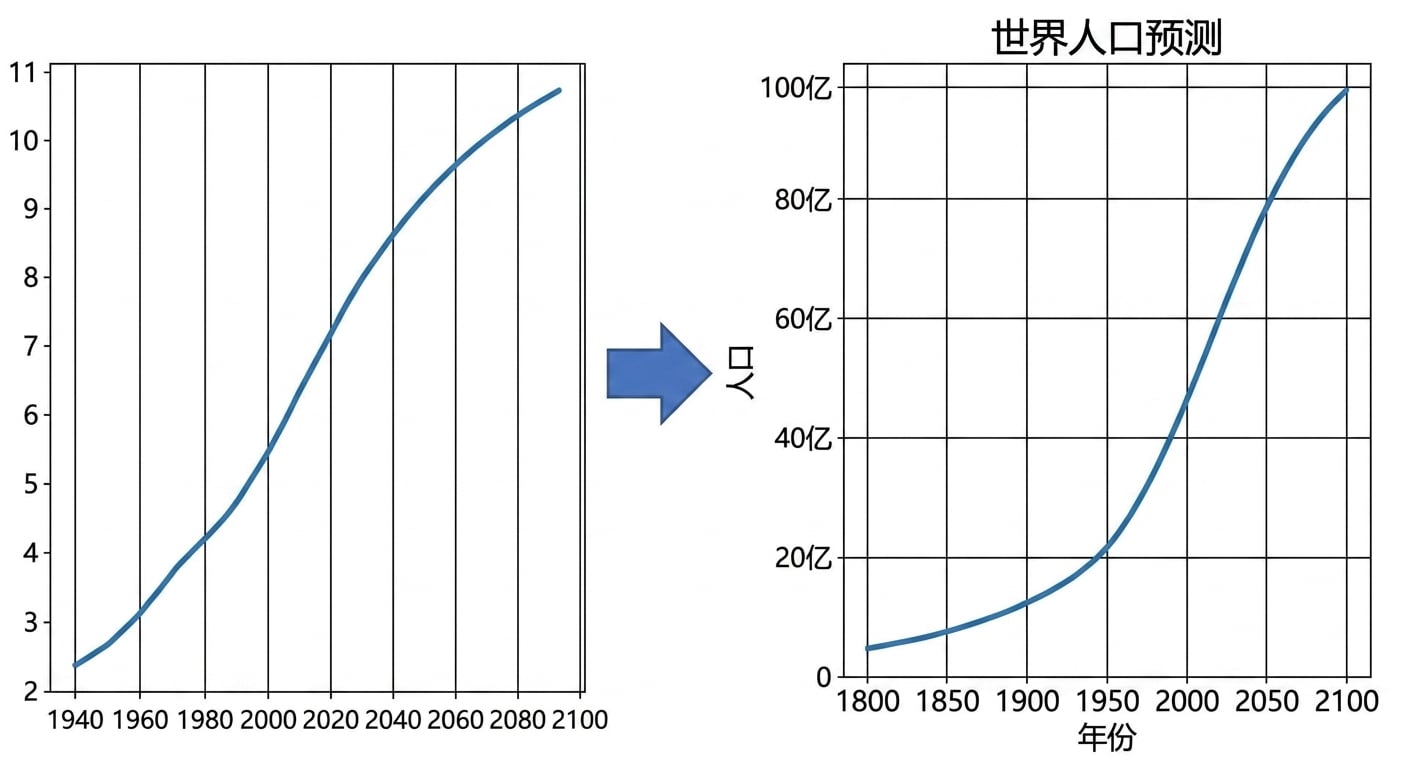
前后对比

ch1_3_slides.031.png

Python 中级

Passons à la pratique !

Python 中级

Preparing Video For Download...