使用 Matplotlib 绘制基础图表
Python 中级

Hugo Bowne-Anderson
Data Scientist at DataCamp
使用 Matplotlib 绘制基础图表
- 可视化

- 数据结构

- 控制结构

- 案例研究

数据可视化
在数据分析中非常重要
- 探索数据
- 报告洞见
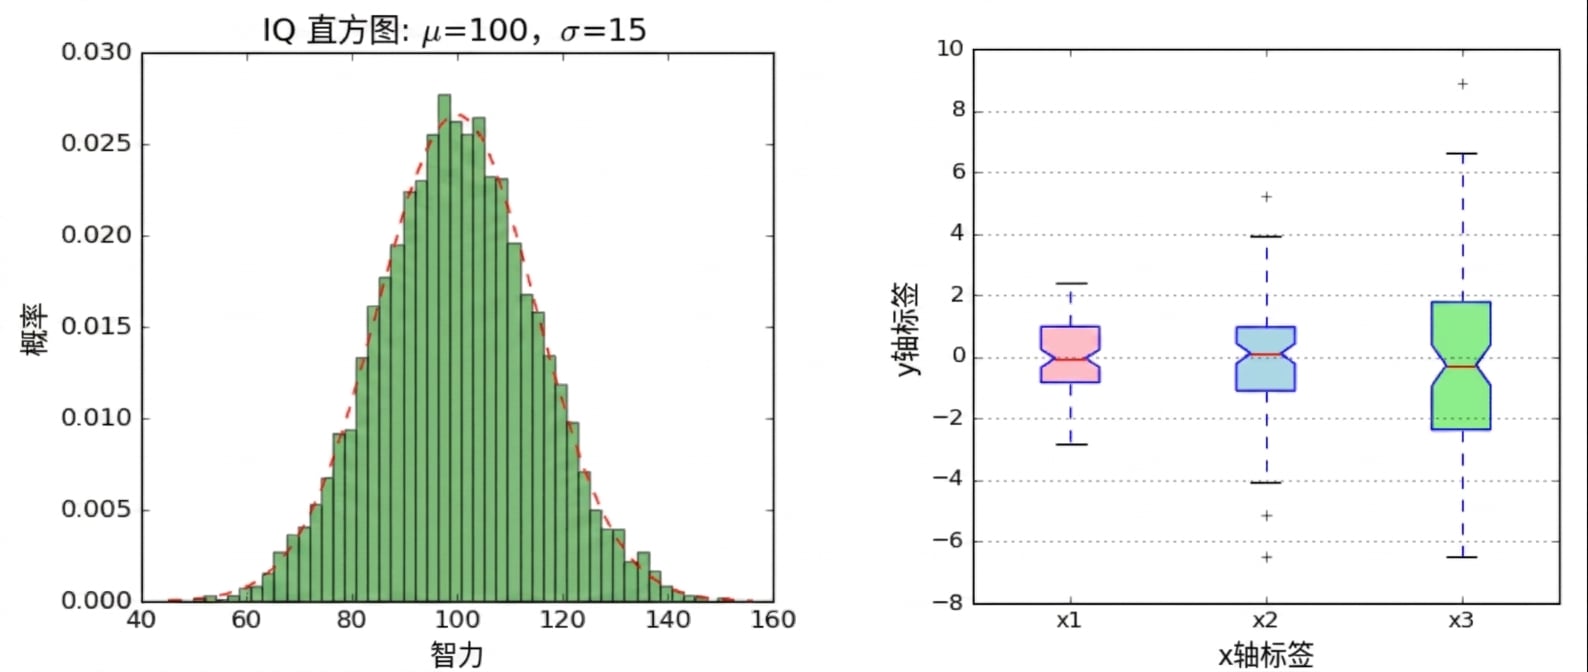
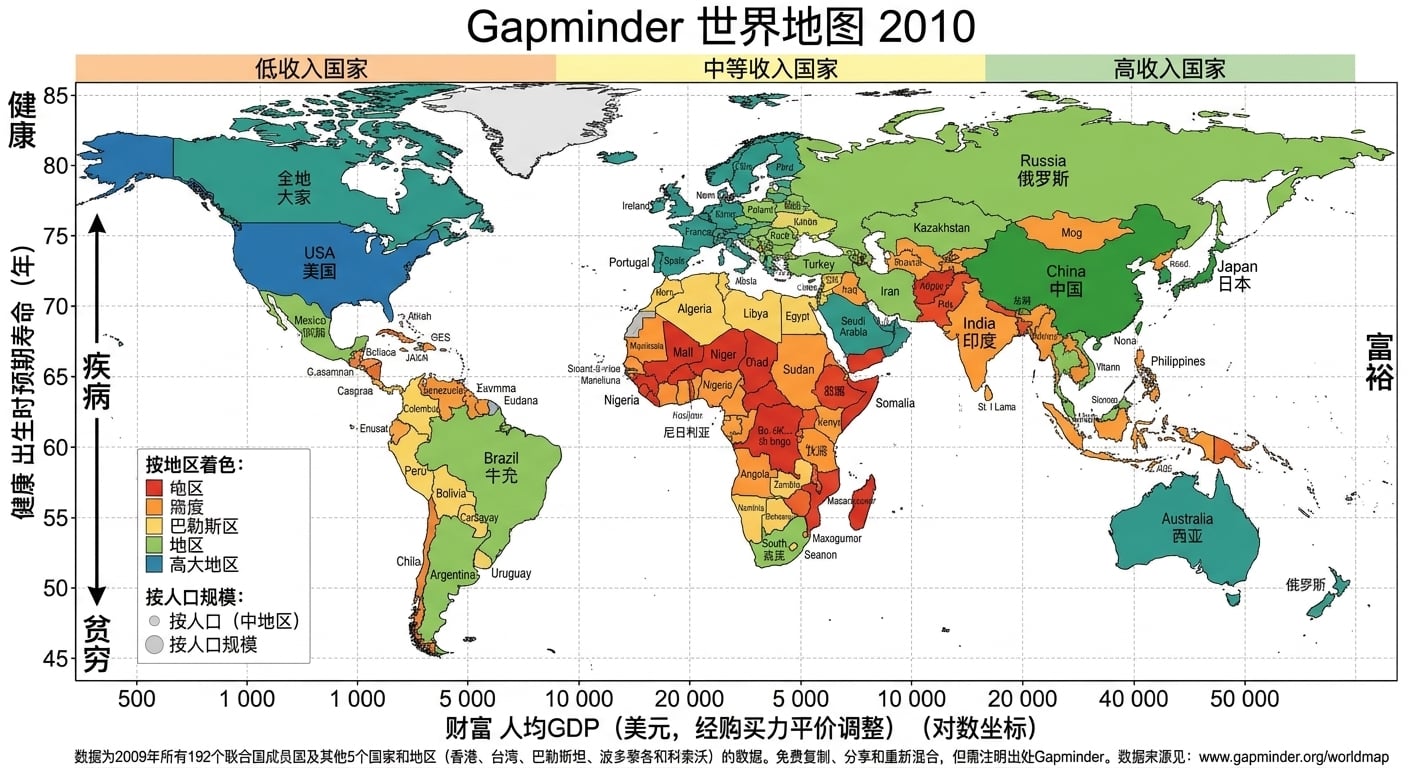
1 来源:GapMinder,Wealth and Health of Nations
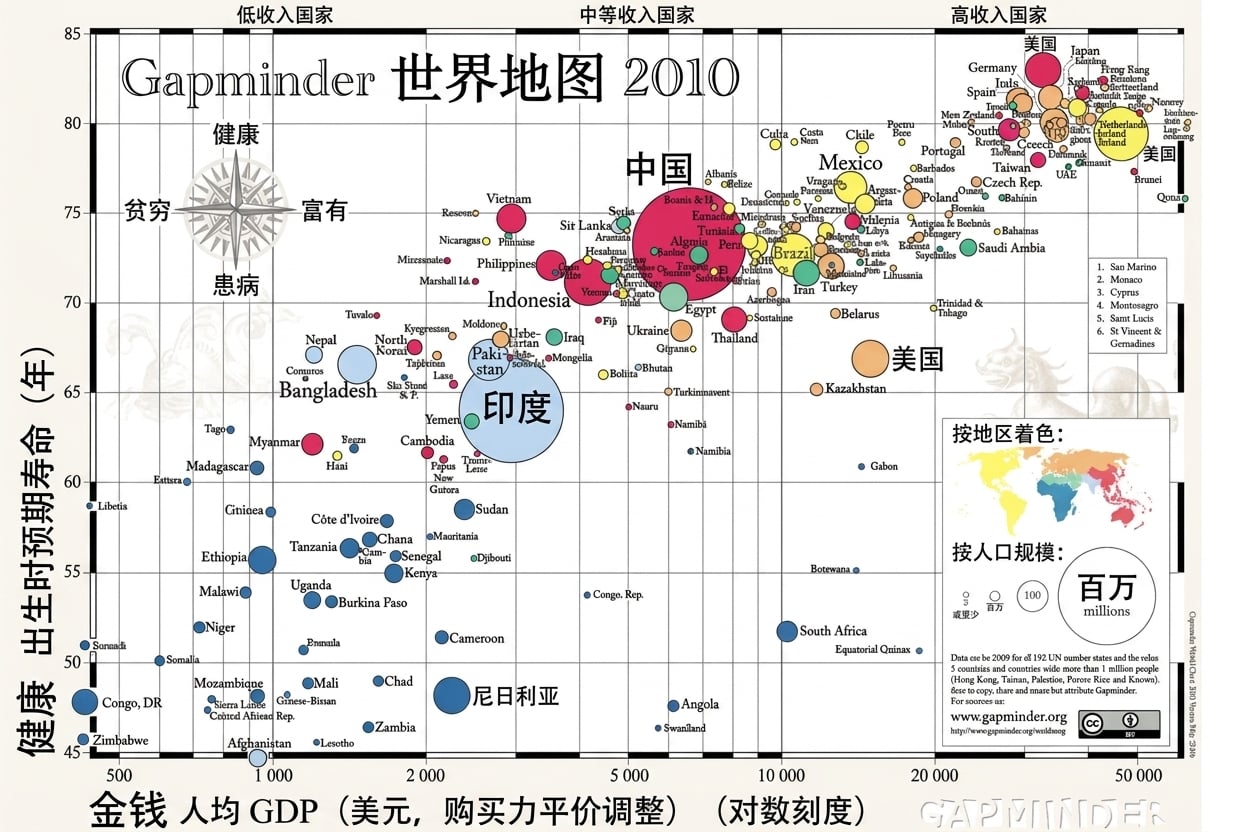
1 来源:GapMinder,Wealth and Health of Nations
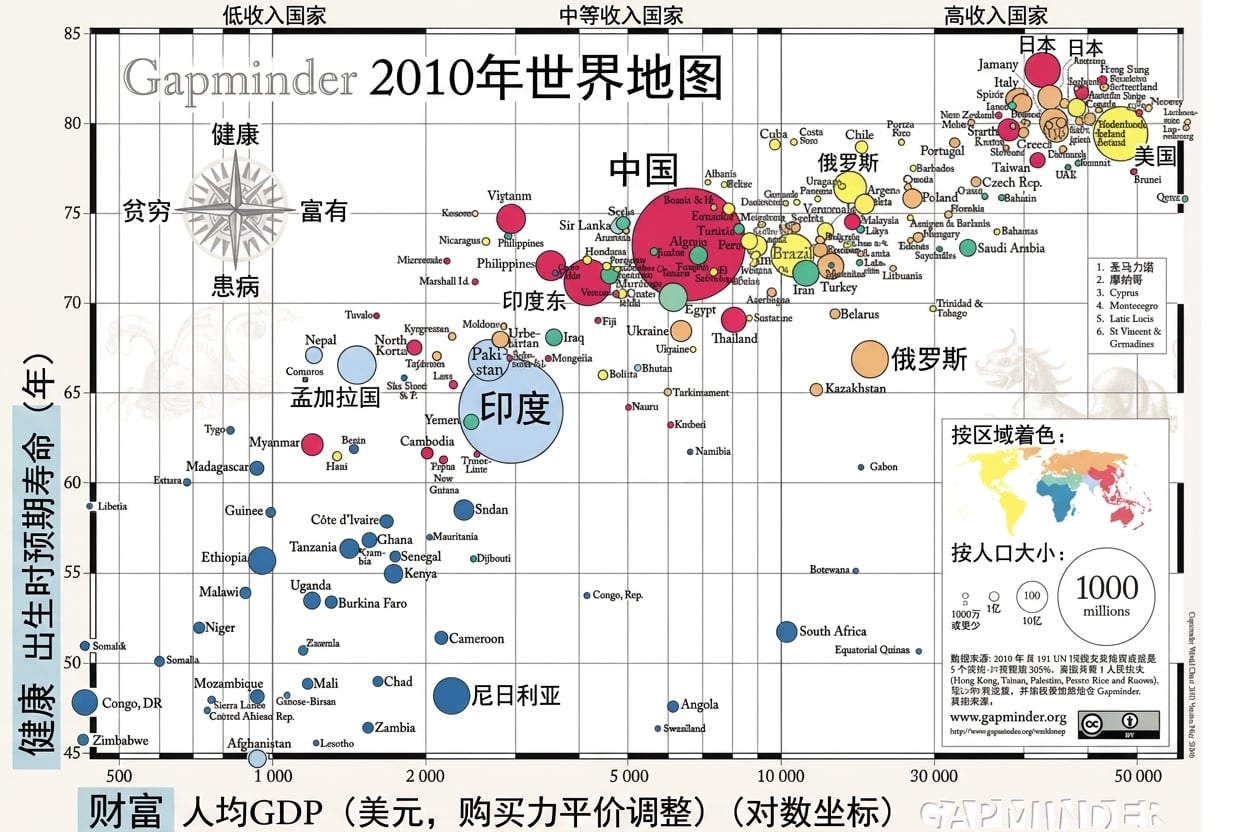
1 来源:GapMinder,Wealth and Health of Nations
Matplotlib
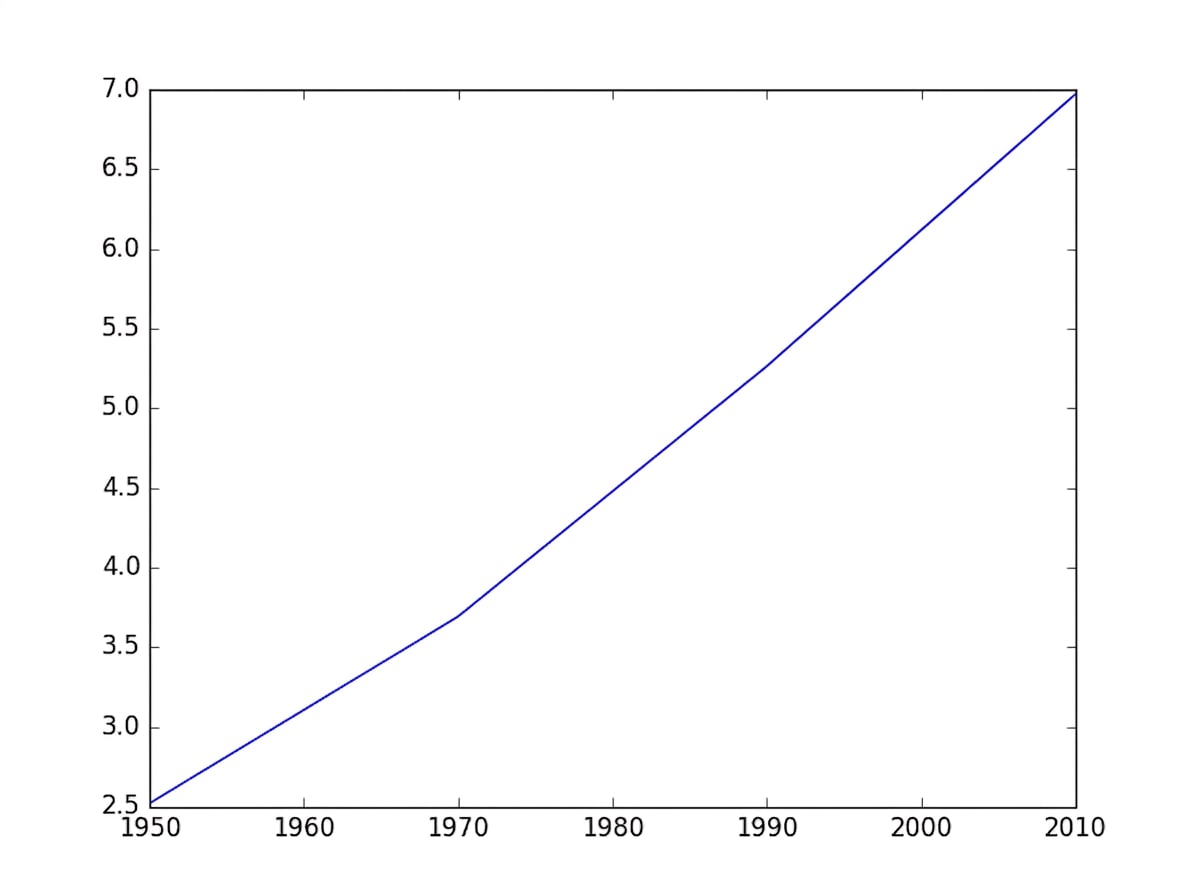
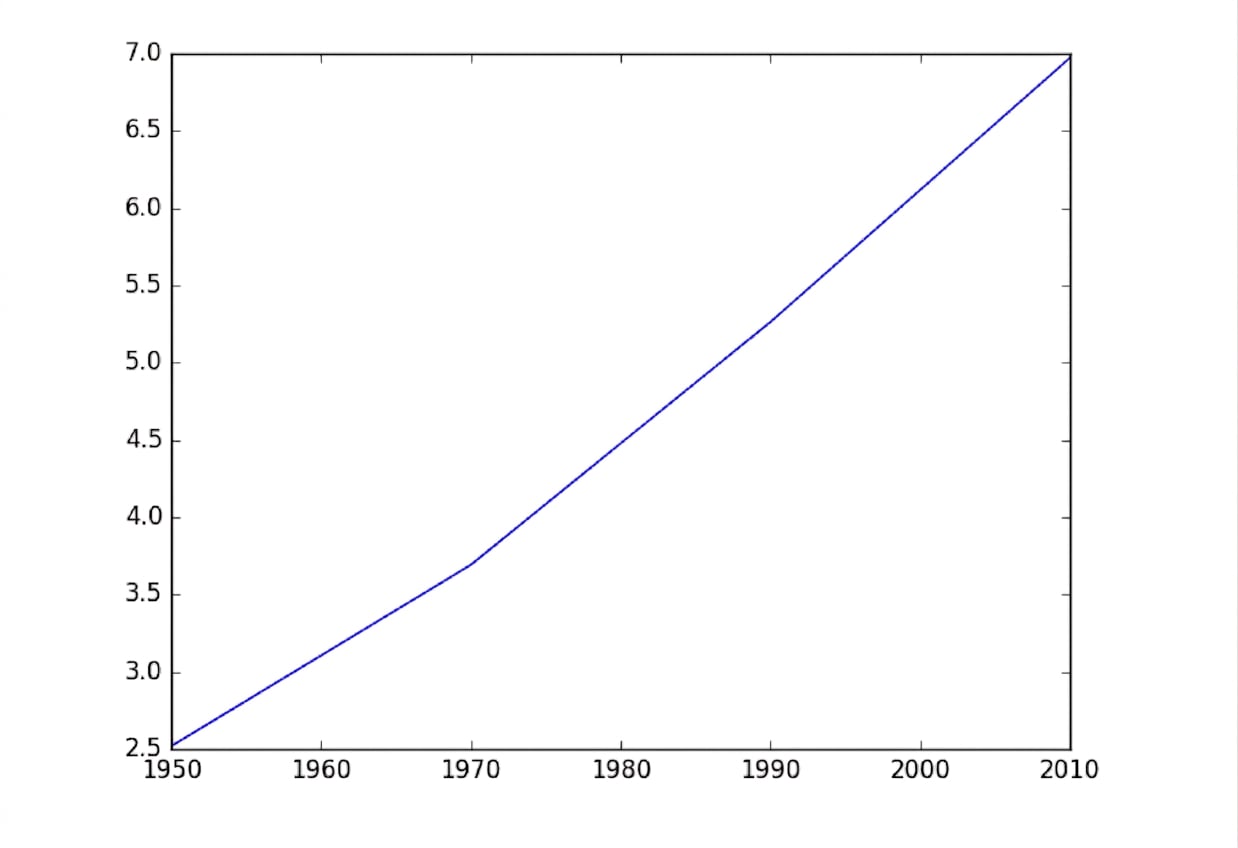
import matplotlib.pyplot as pltyear = [1950, 1970, 1990, 2010]pop = [2.519, 3.692, 5.263, 6.972]plt.plot(year, pop)plt.show()
Matplotlib
Matplotlib
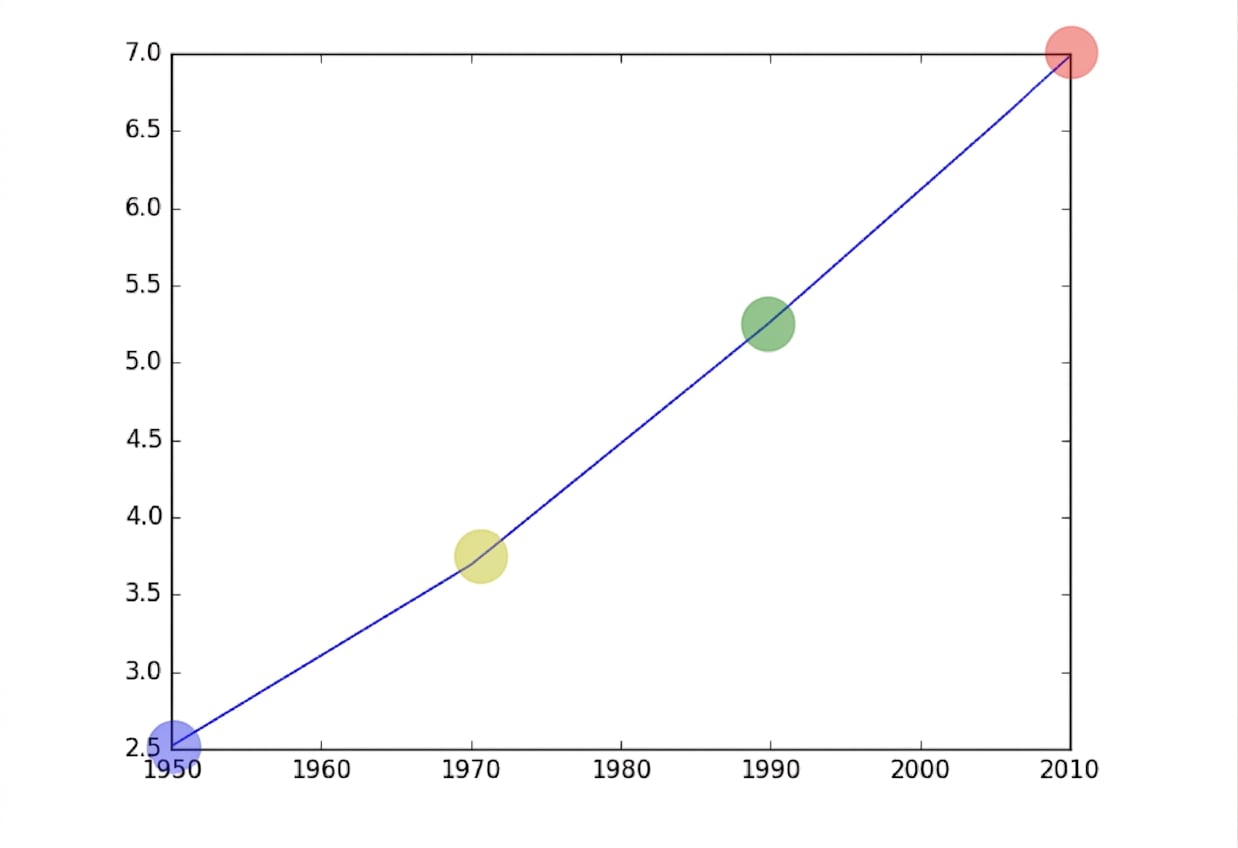

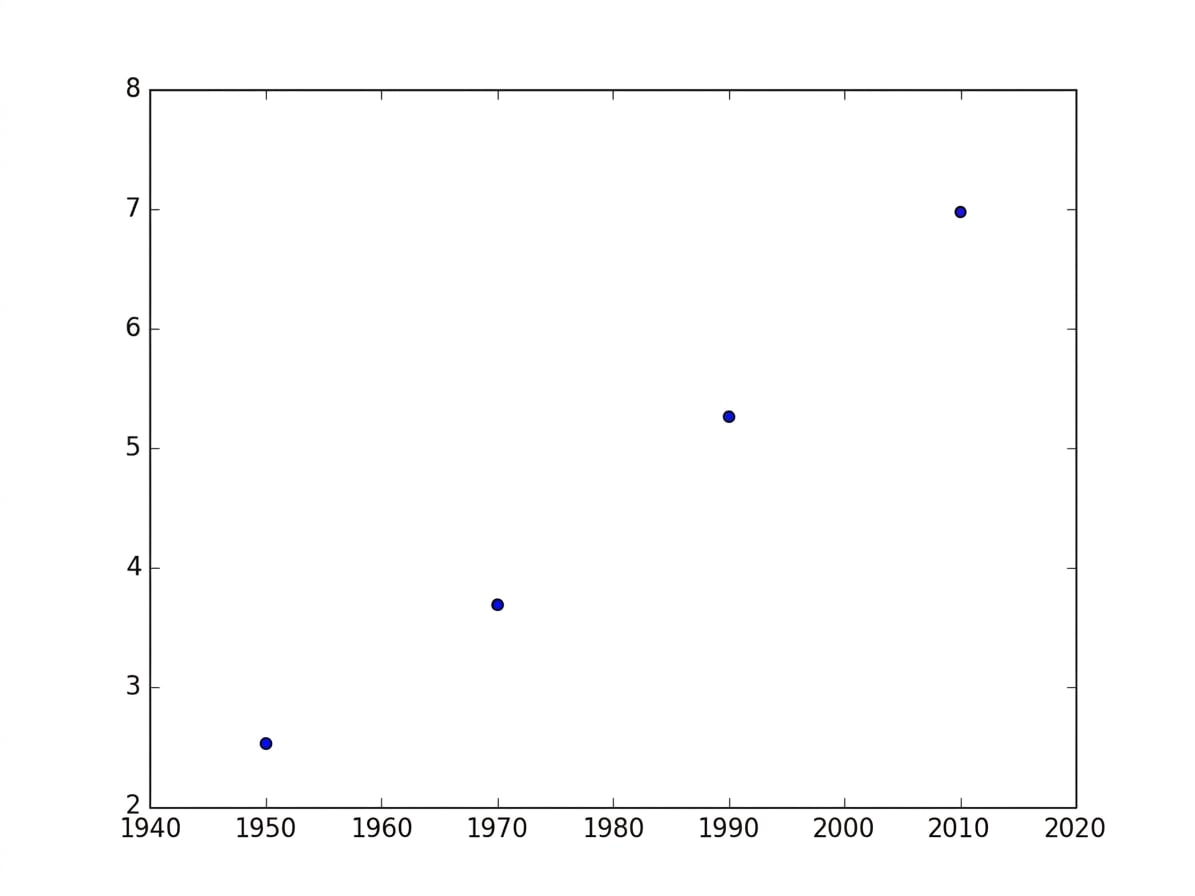
散点图
import matplotlib.pyplot as plt
year = [1950, 1970, 1990, 2010]
pop = [2.519, 3.692, 5.263, 6.972]
plt.scatter(year, pop)
plt.show()