Python 统计学入门
Maggie Matsui
Content Developer, DataCamp
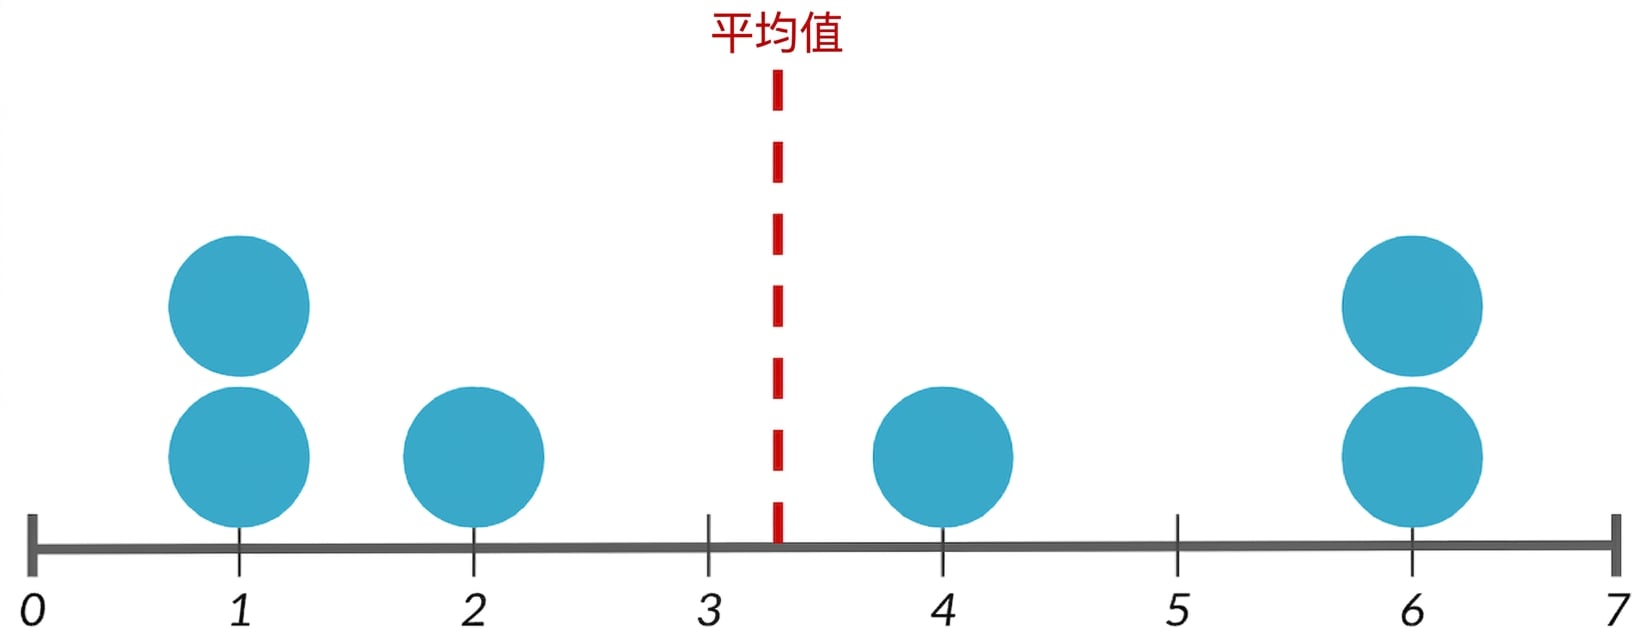
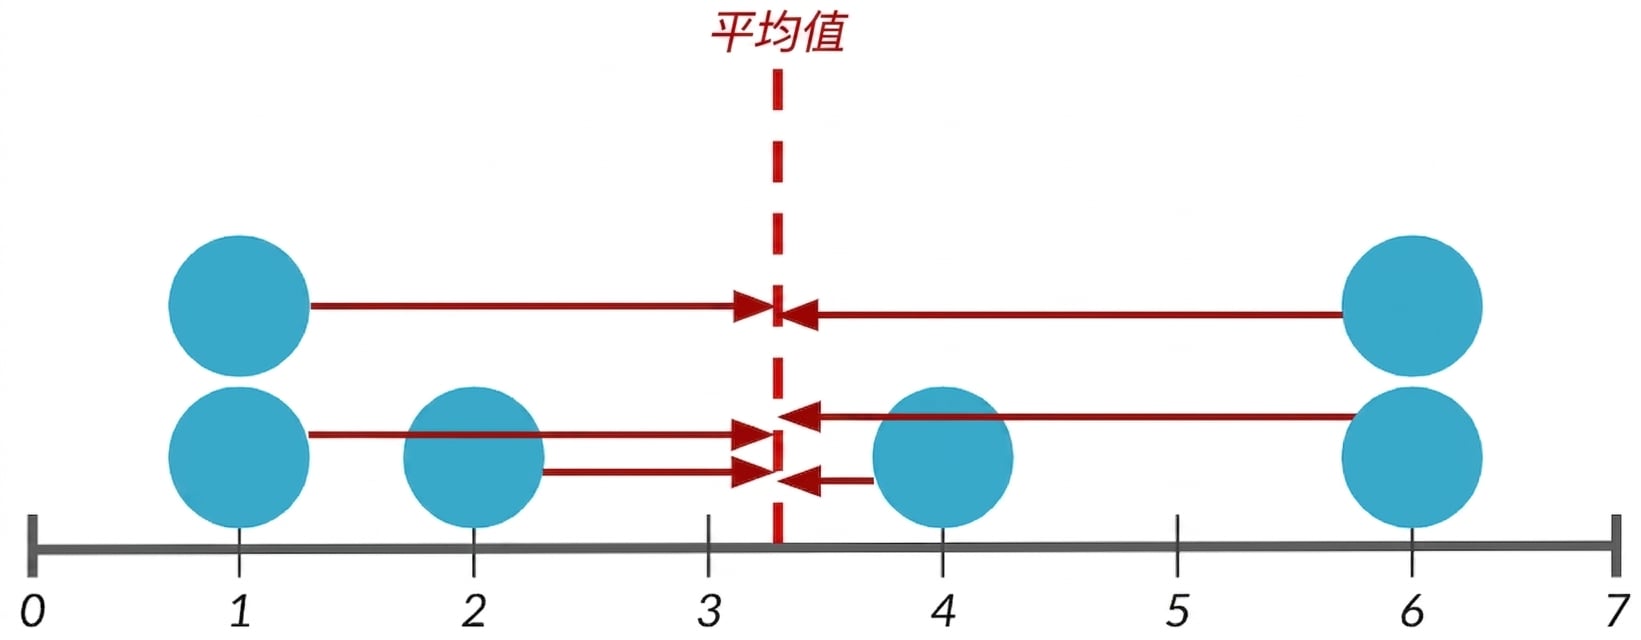
每个数据点到均值的平均距离
1. 每个数据点减去均值
dists = msleep['sleep_total'] -
        np.mean(msleep['sleep_total'])
print(dists)
0     1.666265
1     6.566265
2     3.966265
3     4.466265
4    -6.433735
      ...
2. 距离平方
sq_dists = dists ** 2
print(sq_dists)
0      2.776439
1     43.115837
2     15.731259
3     19.947524
4     41.392945
      ...
3. 距离平方求和
sum_sq_dists = np.sum(sq_dists)
print(sum_sq_dists)
1624.065542
4. 除以数据点数减 1
variance = sum_sq_dists / (83 - 1)
print(variance)
19.805677
使用 np.var()
np.var()
np.var(msleep['sleep_total'], ddof=1)
不传 ddof=1 时,计算的是总体方差而非样本方差:
ddof=1
np.var(msleep['sleep_total'])
19.567055
np.sqrt(np.var(msleep['sleep_total'], ddof=1))
4.450357
np.std(msleep['sleep_total'], ddof=1)
dists = msleep['sleep_total'] - np.mean(msleep['sleep_total'])

np.mean(np.abs(dists))
dists = msleep['sleep_total'] - np.mean(msleep['sleep_total'])
np.mean(np.abs(dists))
3.566701
标准差 vs. 平均绝对偏差
np.quantile(msleep['sleep_total'], 0.5)
10.1
$$
0.5 分位数 = 中位数
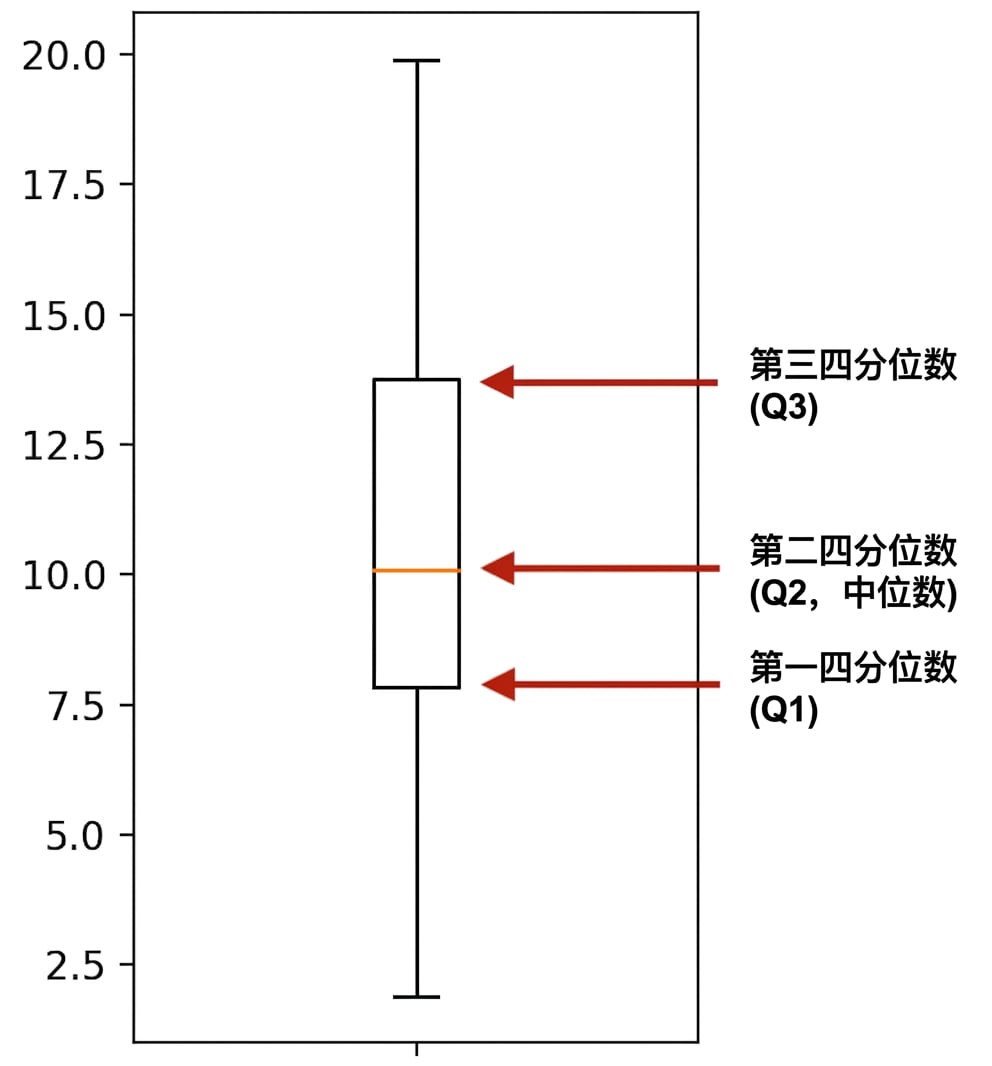
四分位数:
np.quantile(msleep['sleep_total'], [0, 0.25, 0.5, 0.75, 1])
array([ 1.9 , 7.85, 10.1 , 13.75, 19.9 ])
import matplotlib.pyplot as plt
plt.boxplot(msleep['sleep_total'])
plt.show()
np.quantile(msleep['sleep_total'], [0, 0.2, 0.4, 0.6, 0.8, 1])
array([ 1.9 , 6.24, 9.48, 11.14, 14.4 , 19.9 ])
np.linspace(start, stop, num)
np.quantile(msleep['sleep_total'], np.linspace(0, 1, 5))
箱线图中箱体的高度
np.quantile(msleep['sleep_total'], 0.75) - np.quantile(msleep['sleep_total'], 0.25)
5.9
from scipy.stats import iqr
iqr(msleep['sleep_total'])
离群值: 与其他数据明显不同的数据点
如何判断"明显不同"?若满足以下任一条件则为离群值:
from scipy.stats import iqr
iqr = iqr(msleep['bodywt'])

lower_threshold = np.quantile(msleep['bodywt'], 0.25) - 1.5 * iqr
upper_threshold = np.quantile(msleep['bodywt'], 0.75) + 1.5 * iqr
from scipy.stats import iqr iqr = iqr(msleep['bodywt'])
lower_threshold = np.quantile(msleep['bodywt'], 0.25) - 1.5 * iqr upper_threshold = np.quantile(msleep['bodywt'], 0.75) + 1.5 * iqr
msleep[(msleep['bodywt'] < lower_threshold) | (msleep['bodywt'] > upper_threshold)]
                    name   vore  sleep_total    bodywt
4                    Cow  herbi          4.0   600.000
20        Asian elephant  herbi          3.9  2547.000
22                 Horse  herbi          2.9   521.000
...
msleep['bodywt'].describe()
count      83.000000
mean      166.136349
std       786.839732
min         0.005000
25%         0.174000
50%         1.670000
75%        41.750000
max      6654.000000
Name: bodywt, dtype: float64