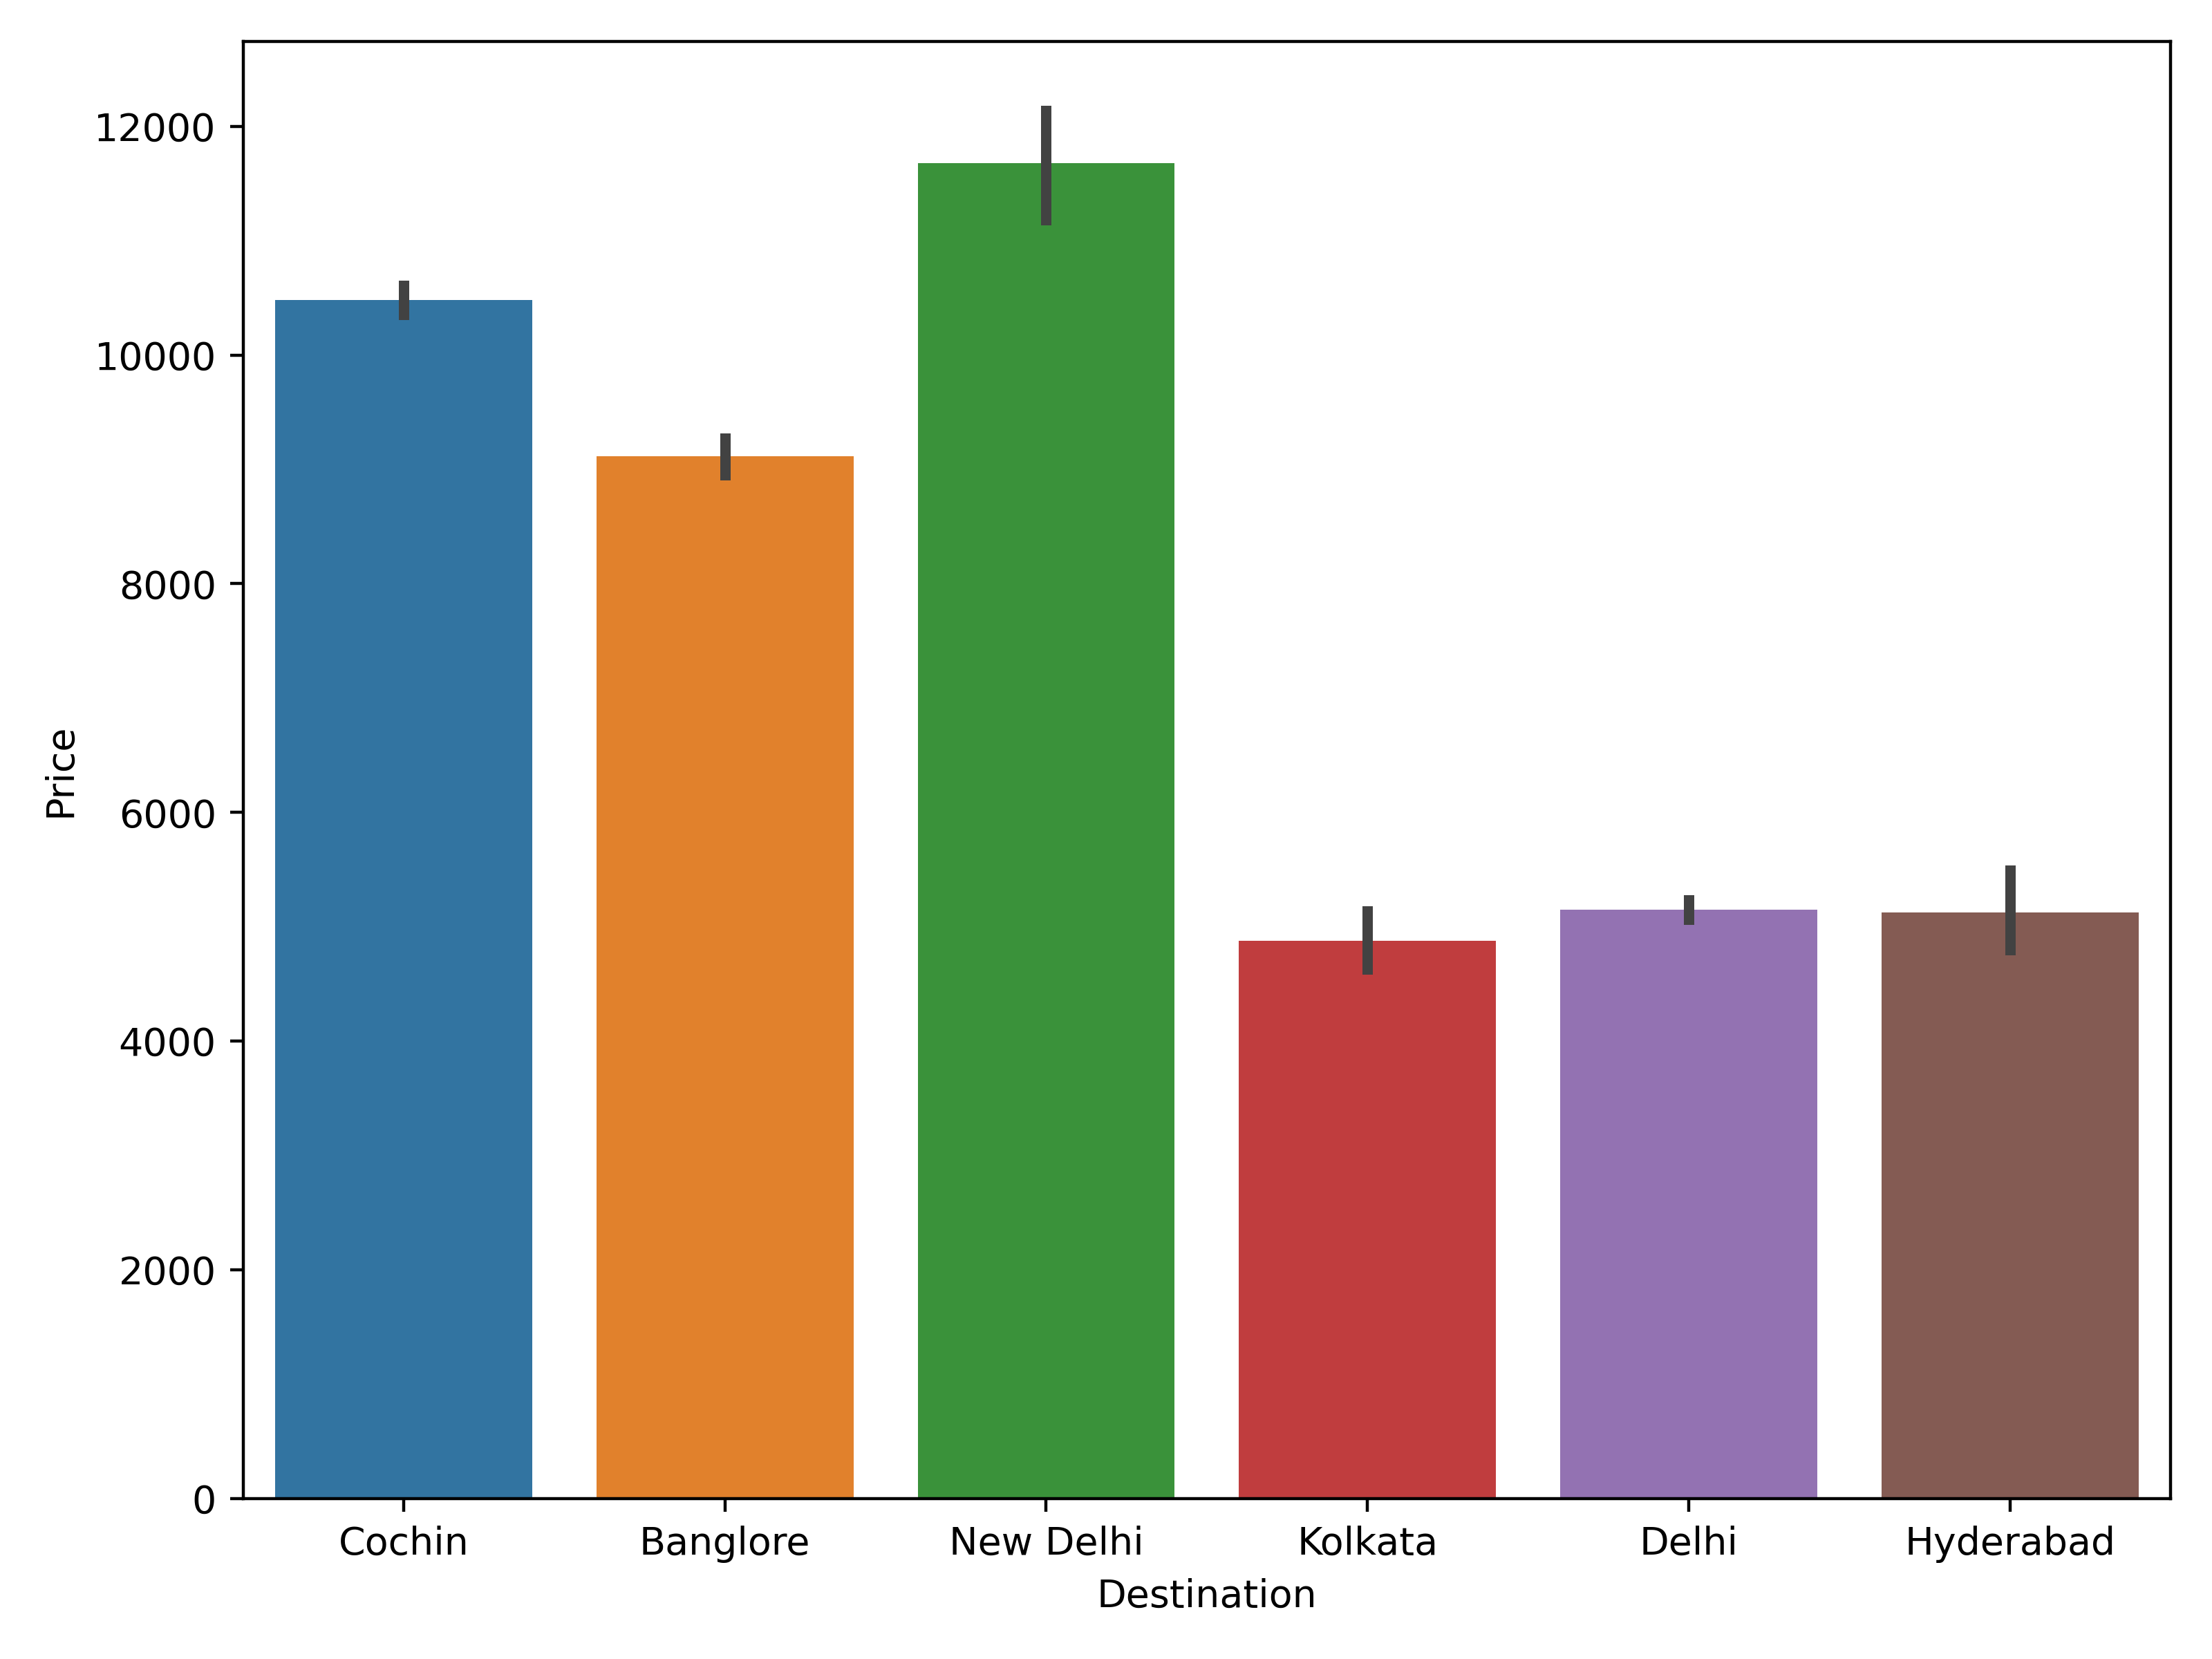
生成假设
Python 中的探索性数据分析

George Boorman
Curriculum Manager, DataCamp
我们知道什么?
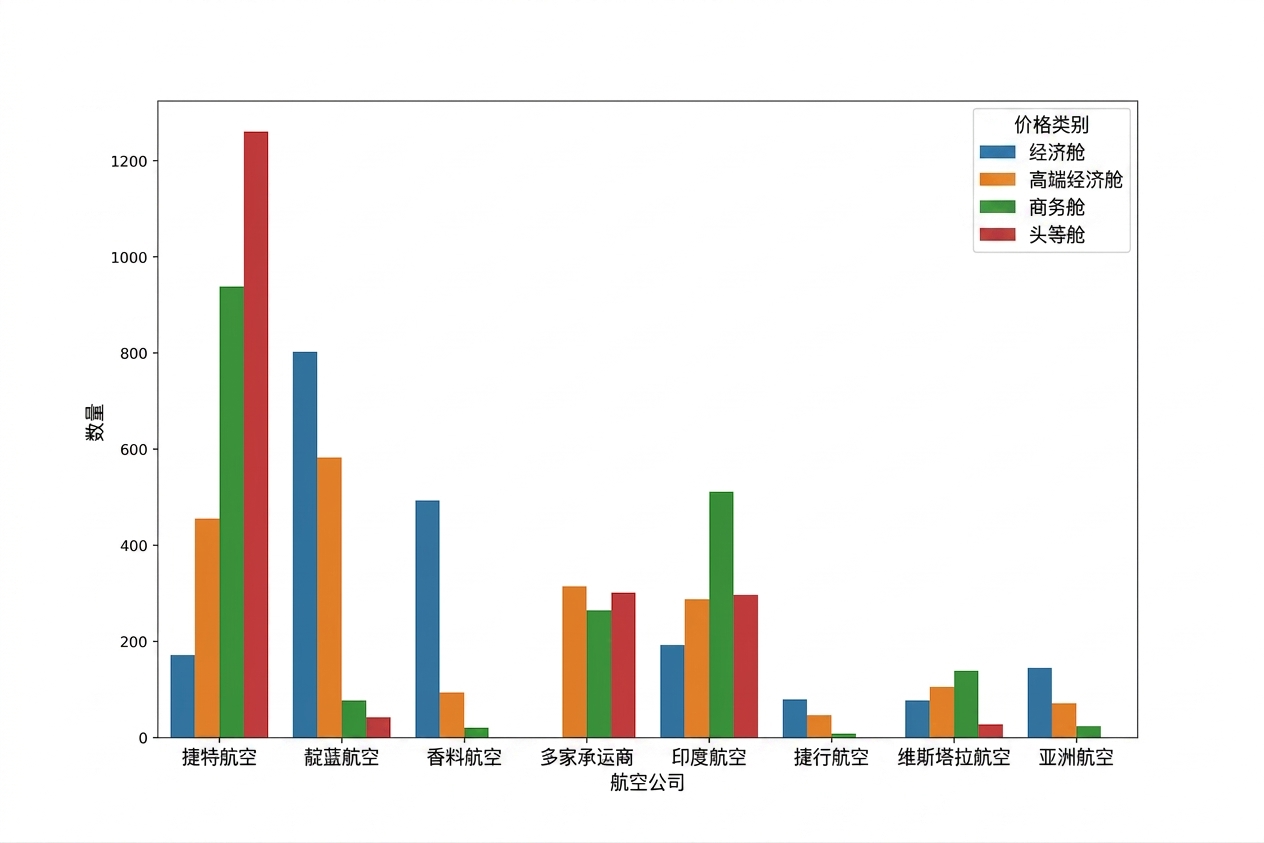
我们知道什么?
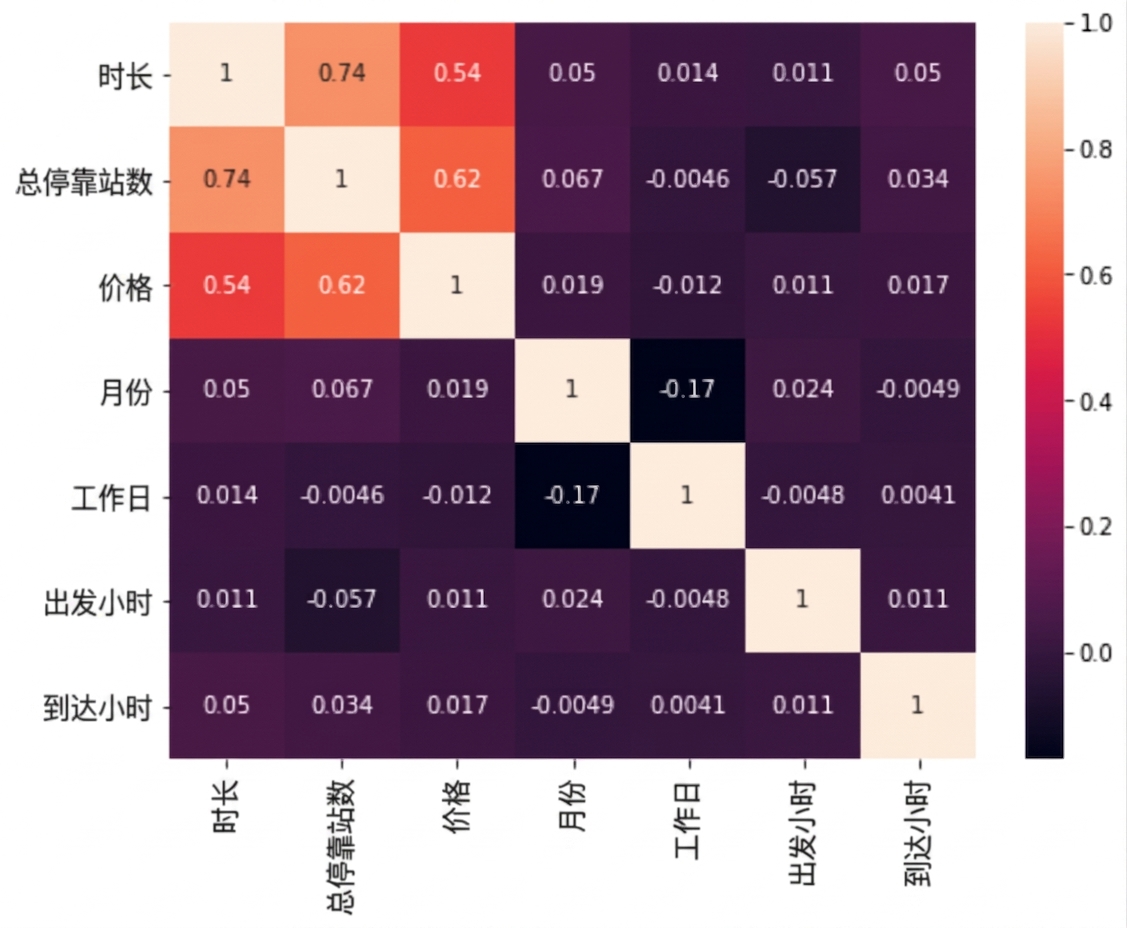
sns.heatmap(planes.corr(numeric_only=True), annot=True)
plt.show()
伪相关
sns.scatterplot(data=planes, x="Duration", y="Price", hue="Total_Stops")
plt.show()

我们如何得知?

什么是真实的?

1 图片来源: https://unsplash.com/@markuswinkler
数据窥探


生成假设
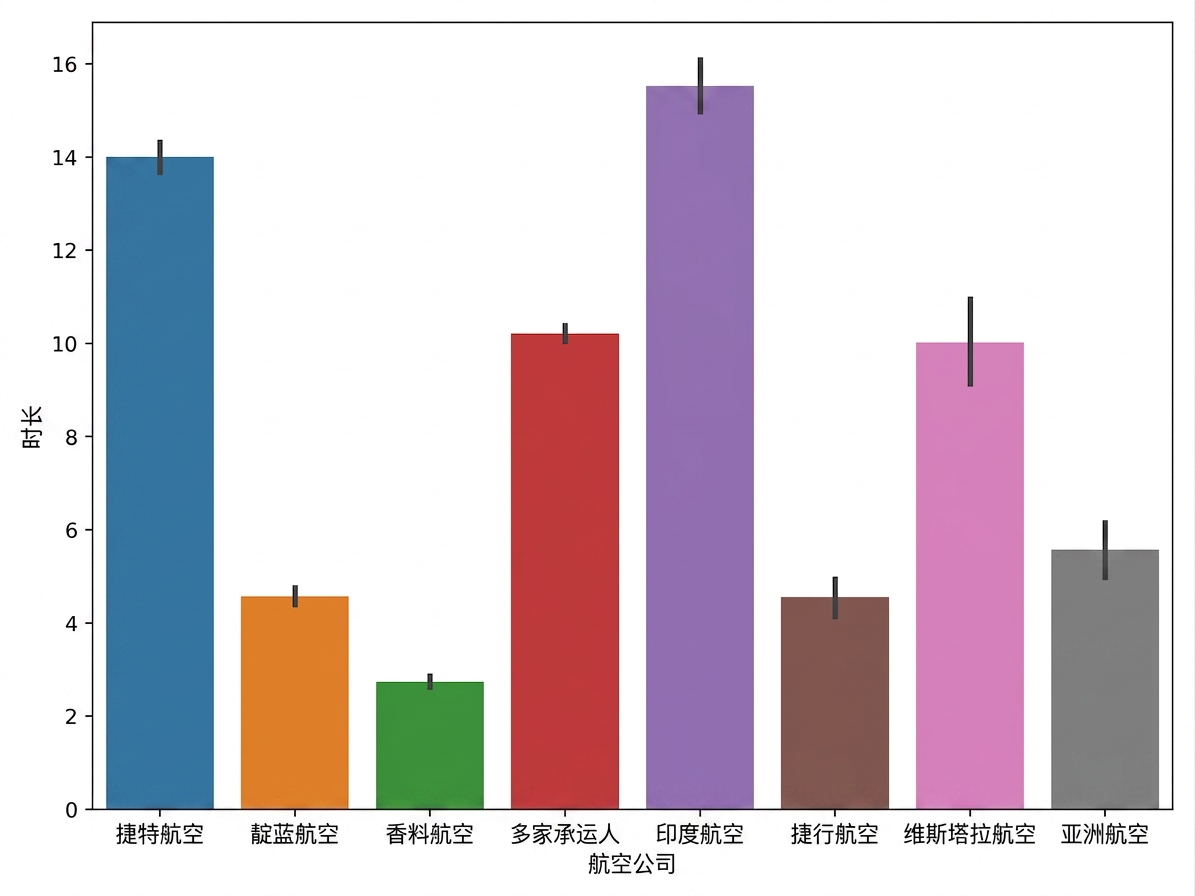
生成假设