使用 ggplot2 进行数据可视化入门
Rick Scavetta
Founder, Scavetta Academy
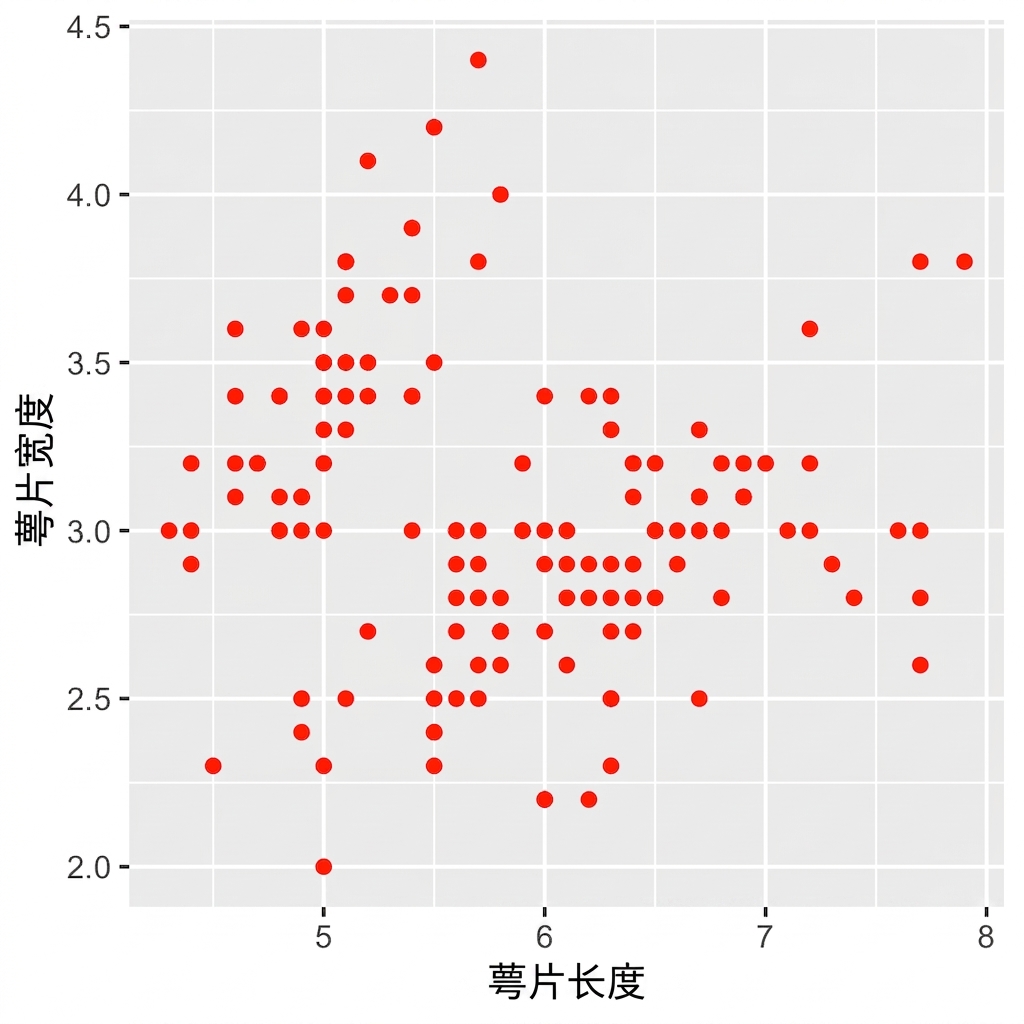
ggplot(iris, aes(x = Sepal.Length,
                 y = Sepal.Width)) +
  geom_point(color = "red")
在 geom_*() 中设置属性。
geom_*()
将颜色属性设置为"red"。
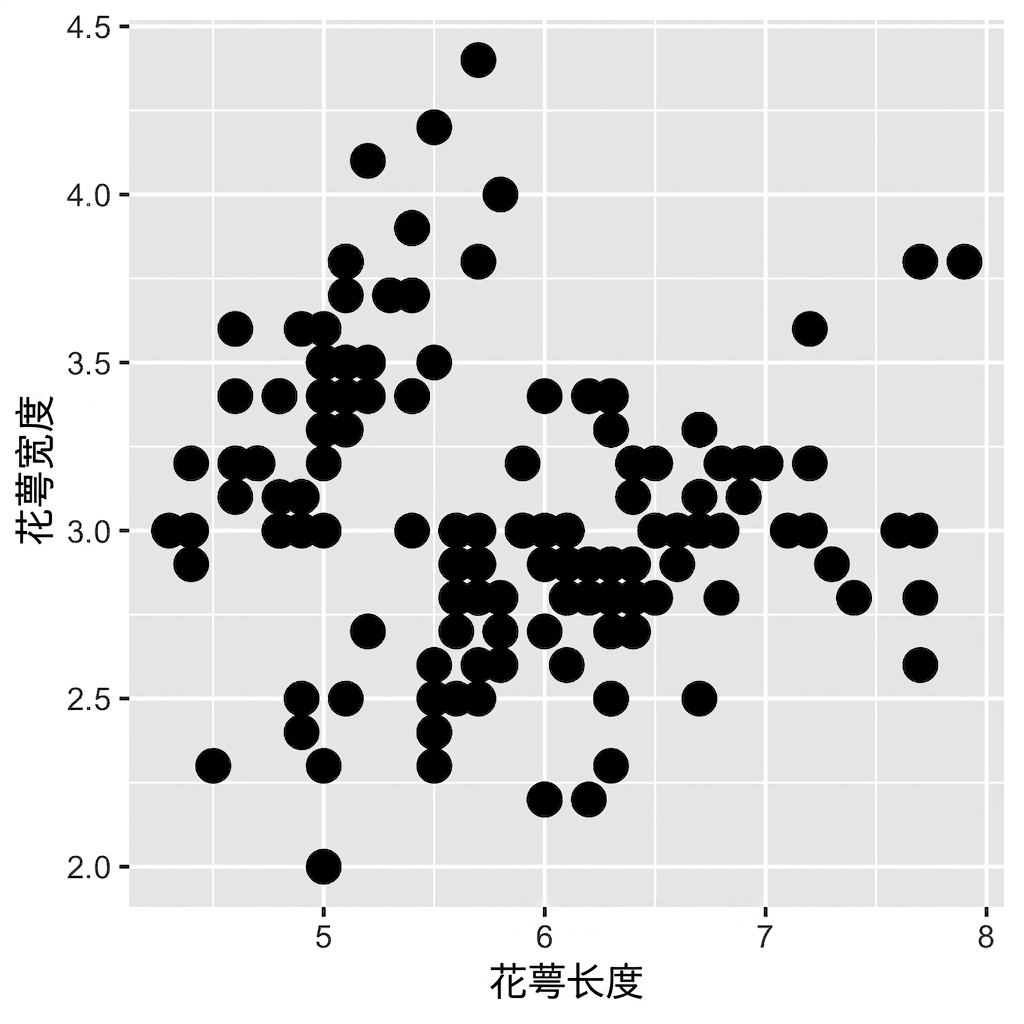
ggplot(iris, aes(x = Sepal.Length,
                 y = Sepal.Width)) +
  geom_point(size = 10)
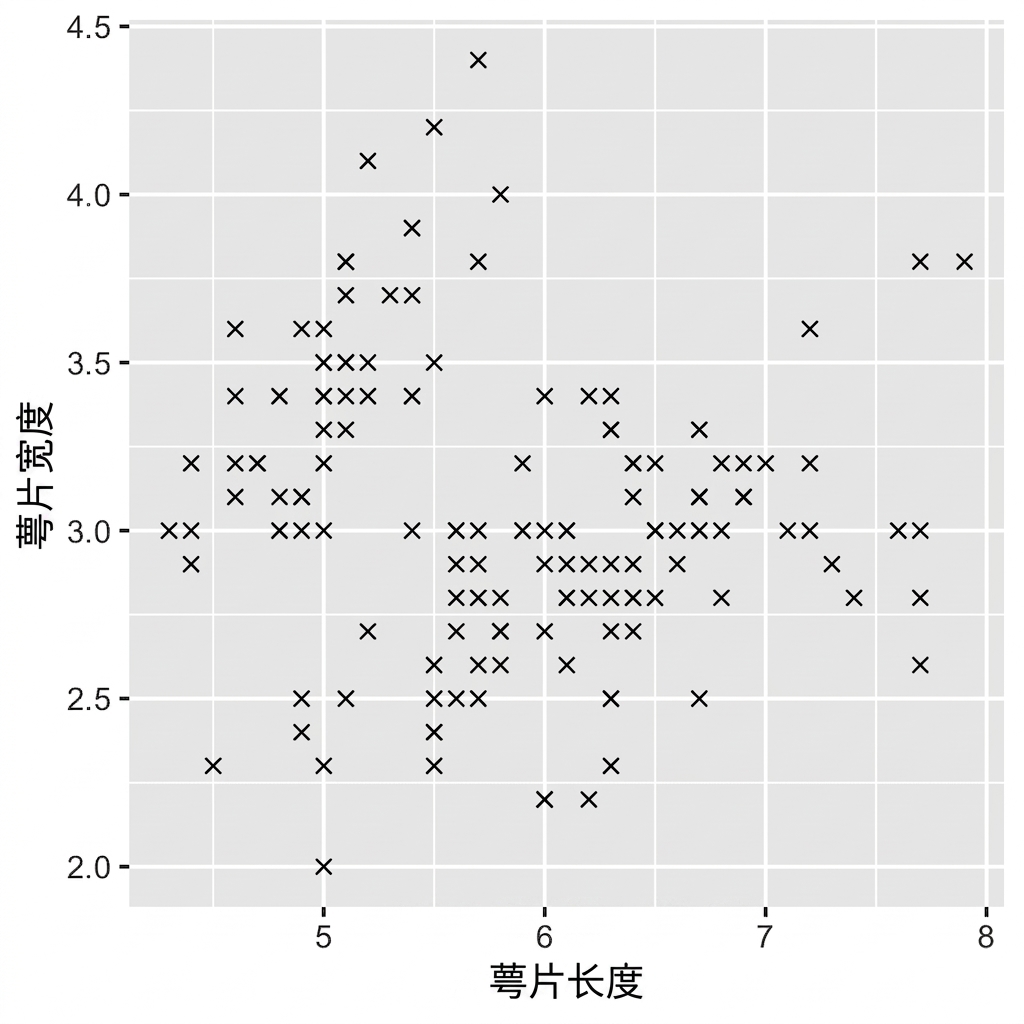
ggplot(iris, aes(x = Sepal.Length,
                 y = Sepal.Width)) +
  geom_point(shape = 4)