ggplot2 图层

使用 ggplot2 进行数据可视化入门

Rick Scavetta

Founder, Scavetta Academy

ggplot2 包

  • 在 R 中实现的图形语法
  • 两个关键概念:
    1. 图层语法要素
    2. 美学映射
使用 ggplot2 进行数据可视化入门

数据

使用 ggplot2 进行数据可视化入门

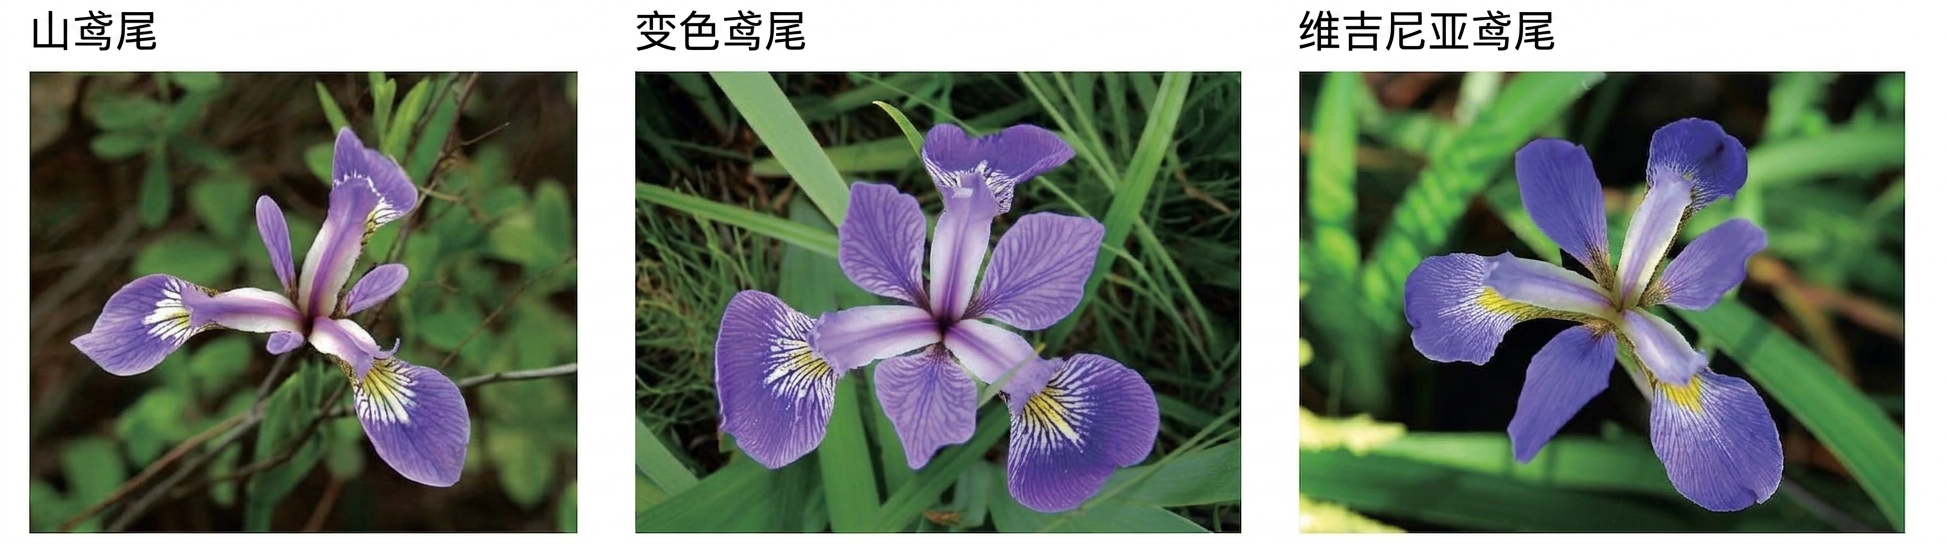
Iris 数据集

1 Fisher, R. A. (1936) The use of multiple measurements in taxonomic problems. Annals of Eugenics, 7, Part II, 179–188. 2 Anderson, Edgar (1935). The irises of the Gaspe Peninsula, Bulletin of the American Iris Society, 59, 2–5.
使用 ggplot2 进行数据可视化入门

Iris 数据集

iris
    Sepal.Length Sepal.Width Petal.Length Petal.Width    Species
1            5.1         3.5          1.4         0.2     setosa
2            4.9         3.0          1.4         0.2     setosa
3            4.7         3.2          1.3         0.2     setosa
...
50           5.0         3.3          1.4         0.2     setosa
51           7.0         3.2          4.7         1.4 versicolor
52           6.4         3.2          4.5         1.5 versicolor
53           6.9         3.1          4.9         1.5 versicolor
...
100          5.7         2.8          4.1         1.3 versicolor
101          6.3         3.3          6.0         2.5  virginica
102          5.8         2.7          5.1         1.9  virginica
103          7.1         3.0          5.9         2.1  virginica
...
150          5.9         3.0          5.1         1.8  virginica
使用 ggplot2 进行数据可视化入门

美学映射

使用 ggplot2 进行数据可视化入门

Iris 的美学映射

使用 ggplot2 进行数据可视化入门

几何对象

使用 ggplot2 进行数据可视化入门

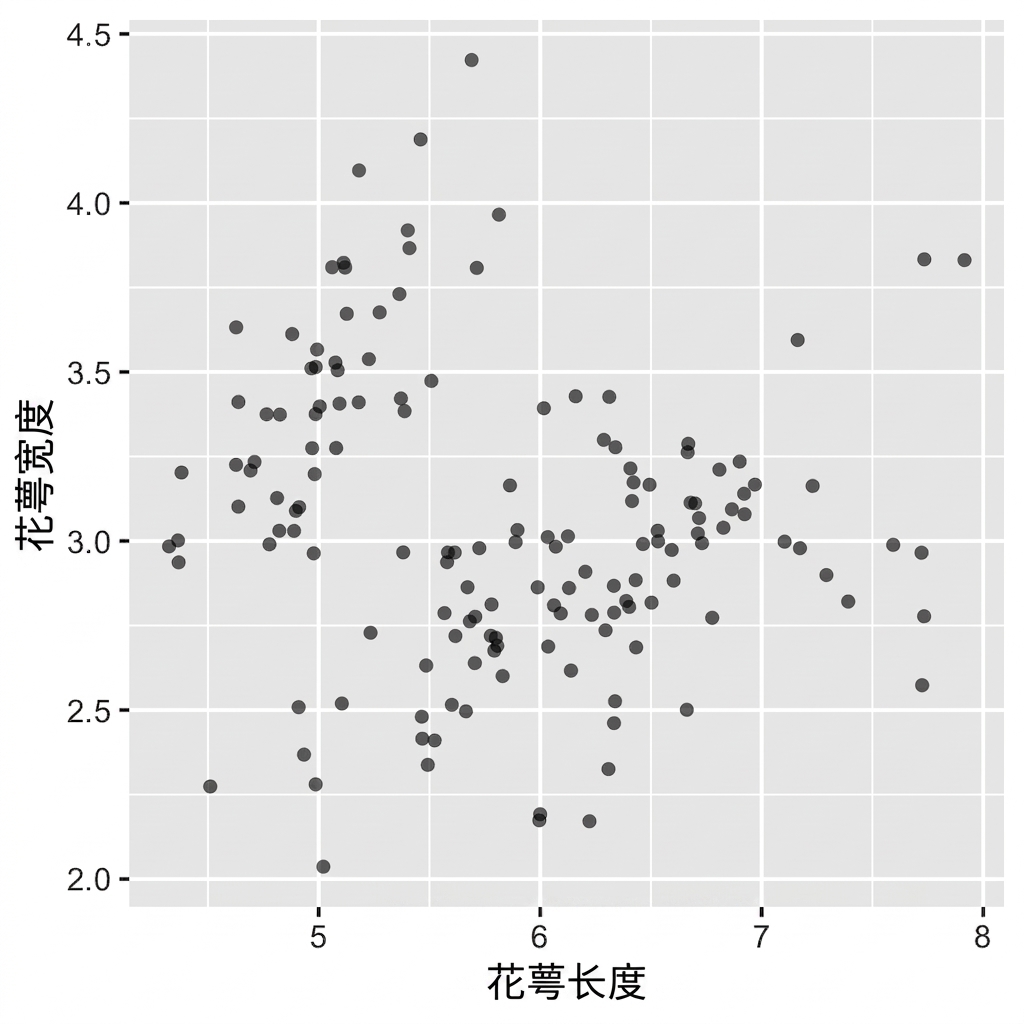
Iris 的几何对象

g <- ggplot(iris, aes(x = Sepal.Length, y = Sepal.Width)) +
  geom_jitter()
g

使用 ggplot2 进行数据可视化入门

主题

使用 ggplot2 进行数据可视化入门

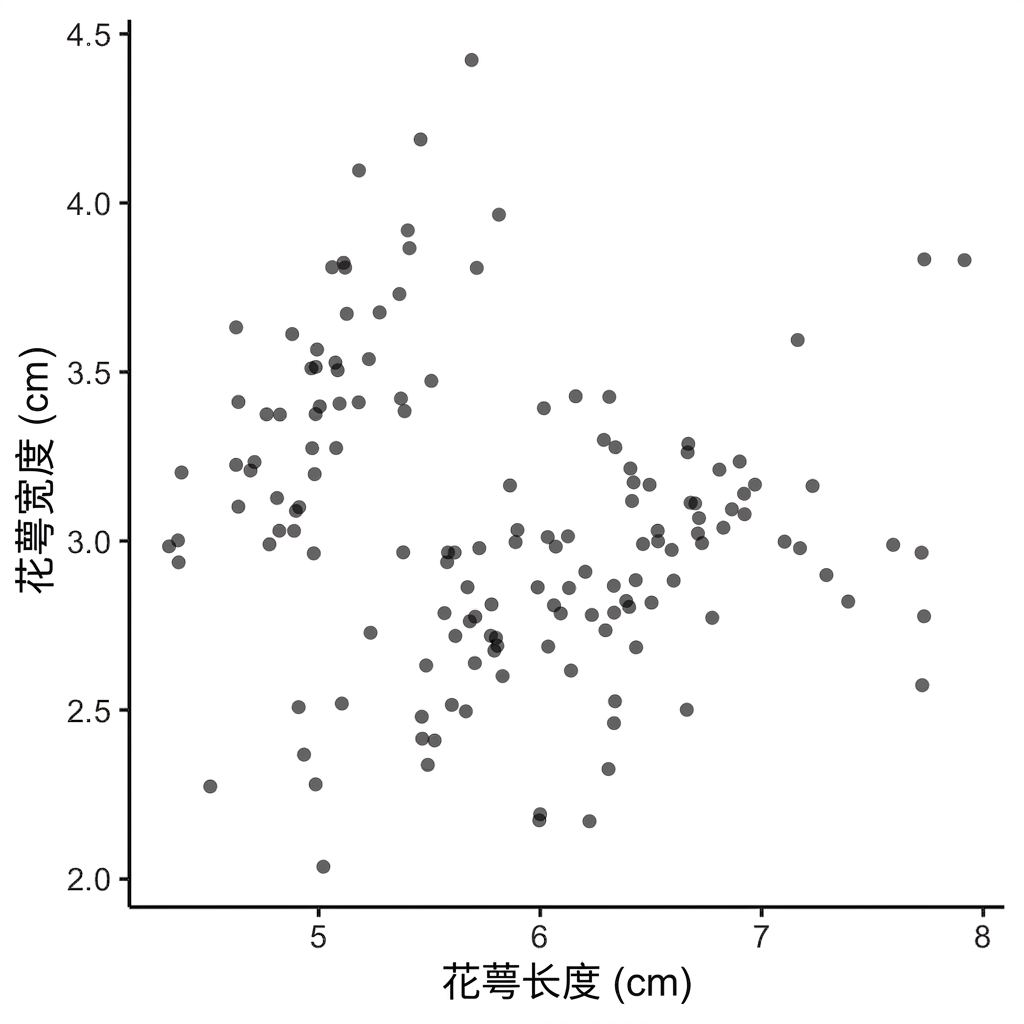
Iris 的主题

g <- g +
  labs(x = "Sepal Length (cm)", y = "Sepal Width (cm)") +
  theme_classic()
g

使用 ggplot2 进行数据可视化入门

让我们练习!

使用 ggplot2 进行数据可视化入门

Preparing Video For Download...