与他人分享你的可视化

Matplotlib 数据可视化入门

Ariel Rokem

Data Scientist

可分享的图形

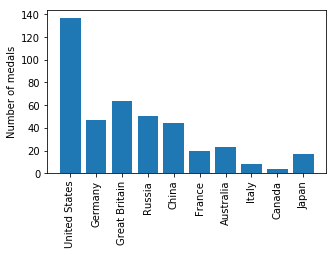
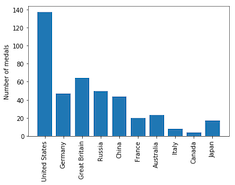
fig, ax = plt.subplots()

ax.bar(medals.index, medals["Gold"])
ax.set_xticklabels(medals.index, rotation=90)
ax.set_ylabel("Number of medals")

plt.show()
Matplotlib 数据可视化入门

将图形保存到文件

fig, ax = plt.subplots()

ax.bar(medals.index, medals["Gold"])
ax.set_xticklabels(medals.index, rotation=90)
ax.set_ylabel("Number of medals")

fig.savefig("gold_medals.png")
ls
gold_medals.png
Matplotlib 数据可视化入门

不同的文件格式

fig.savefig("gold_medals.jpg")
fig.savefig("gold_medals.jpg", quality=50)
fig.savefig("gold_medals.svg")
Matplotlib 数据可视化入门

分辨率

fig.savefig("gold_medals.png", dpi=300)
Matplotlib 数据可视化入门

尺寸

fig.set_size_inches([5, 3])

Matplotlib 数据可视化入门

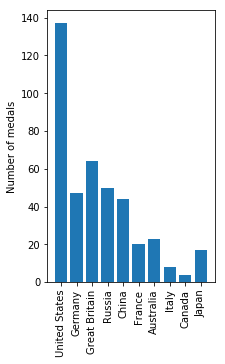
另一种纵横比

fig.set_size_inches([3, 5])

Matplotlib 数据可视化入门

练习保存可视化!

Matplotlib 数据可视化入门

Preparing Video For Download...