小倍数图

Matplotlib 数据可视化入门

Ariel Rokem

Data Scientist

添加数据

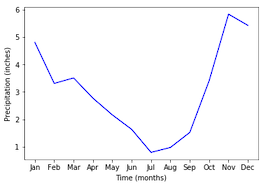
ax.plot(seattle_weather["MONTH"], 
        seattle_weather["MLY-PRCP-NORMAL"], 
        color='b')
ax.set_xlabel("时间(月)")
ax.set_ylabel("降水量(英寸)")
plt.show()
Matplotlib 数据可视化入门

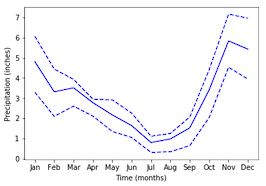
添加更多数据

ax.plot(seattle_weather["MONTH"], seattle_weather["MLY-PRCP-25PCTL"], 
        linestyle='--', color='b')
ax.plot(seattle_weather["MONTH"], seattle_weather["MLY-PRCP-75PCTL"], 
        linestyle='--', color=color)
plt.show()
Matplotlib 数据可视化入门

再添数据

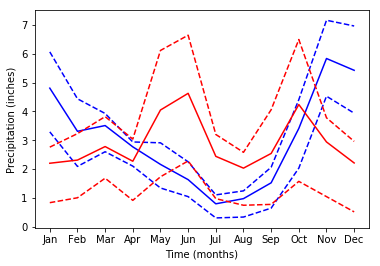
ax.plot(austin_weather["MONTH"], austin_weather["MLY-PRCP-NORMAL"],
        color='r')
ax.plot(austin_weather["MONTH"], austin_weather["MLY-PRCP-25PCTL"], 
        linestyle='--', color='r')
ax.plot(austin_weather["MONTH"], austin_weather["MLY-PRCP-75PCTL"], 
        linestyle='--', color='r')
plt.show()
Matplotlib 数据可视化入门

数据太多!

Matplotlib 数据可视化入门

使用 plt.subplots 的小倍数图

fig, ax = plt.subplots()
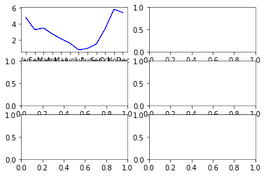
fig, ax = plt.subplots(3, 2)

plt.show()

Matplotlib 数据可视化入门

向子图添加数据

ax.shape
(3, 2)
ax[0, 0].plot(seattle_weather["MONTH"], 
              seattle_weather["MLY-PRCP-NORMAL"], 
              color='b')

plt.show()

Matplotlib 数据可视化入门

含数据的子图

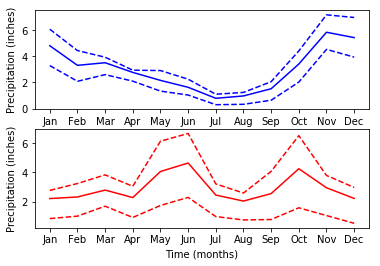
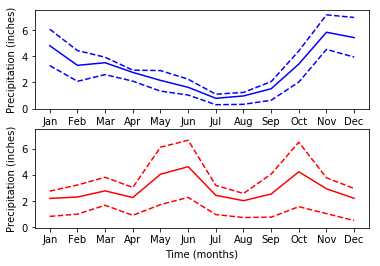
fig, ax = plt.subplots(2, 1)

ax[0].plot(seattle_weather["MONTH"], seattle_weather["MLY-PRCP-NORMAL"], color='b') ax[0].plot(seattle_weather["MONTH"], seattle_weather["MLY-PRCP-25PCTL"], linestyle='--', color='b') ax[0].plot(seattle_weather["MONTH"], seattle_weather["MLY-PRCP-75PCTL"], linestyle='--', color='b')
ax[1].plot(austin_weather["MONTH"], austin_weather["MLY-PRCP-NORMAL"], color='r') ax[1].plot(austin_weather["MONTH"], austin_weather["MLY-PRCP-25PCTL"], linestyle='--', color='r') ax[1].plot(austin_weather["MONTH"], austin_weather["MLY-PRCP-75PCTL"], linestyle='--', color='r')
ax[0].set_ylabel("降水量(英寸)") ax[1].set_ylabel("降水量(英寸)")
ax[1].set_xlabel("时间(月)")
plt.show()
Matplotlib 数据可视化入门

含数据的子图

Matplotlib 数据可视化入门

共享 y 轴范围

fig, ax = plt.subplots(2, 1, sharey=True)
Matplotlib 数据可视化入门

练习制作子图!

Matplotlib 数据可视化入门

Preparing Video For Download...