Matplotlib 数据可视化入门
Ariel Rokem
Data Scientist
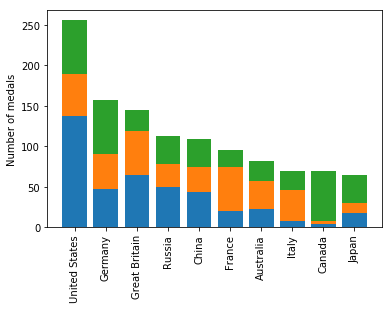
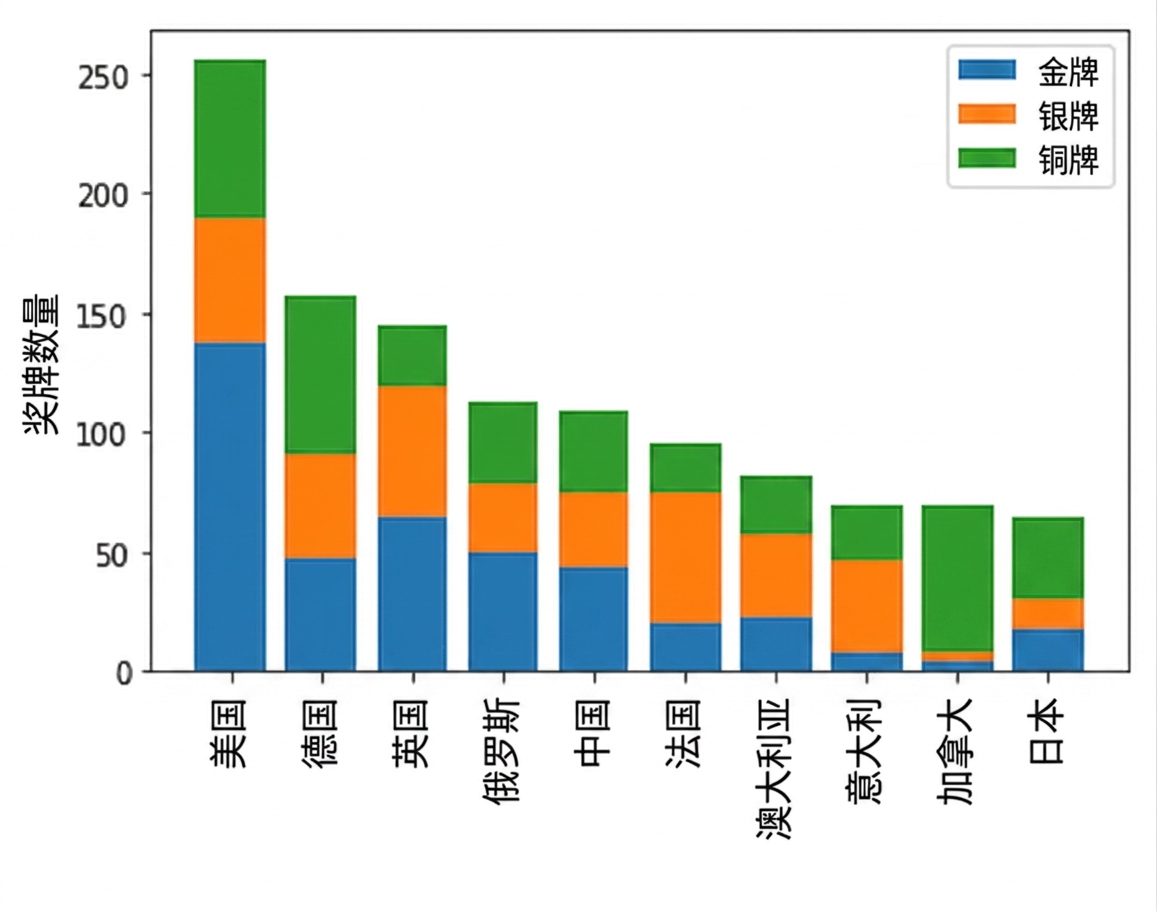
,Gold, Silver, Bronze
United States, 137, 52, 67
Germany, 47, 43, 67
Great Britain, 64, 55, 26
Russia, 50, 28, 35
China, 44, 30, 35
France, 20, 55, 21
Australia, 23, 34, 25
Italy, 8, 38, 24
Canada, 4, 4, 61
Japan, 17, 13, 34
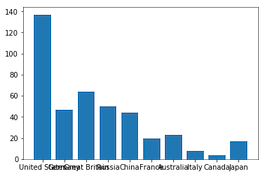
medals = pd.read_csv('medals_by_country_2016.csv', index_col=0)fig, ax = plt.subplots()ax.bar(medals.index, medals["Gold"]) plt.show()
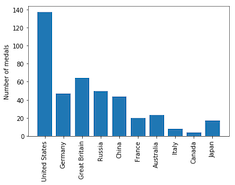
fig, ax = plt.subplots() ax.bar(medals.index, medals["Gold"])ax.set_xticklabels(medals.index, rotation=90) ax.set_ylabel("Number of medals")plt.show()
fig, ax = plt.subplots ax.bar(medals.index, medals["Gold"])ax.bar(medals.index, medals["Silver"], bottom=medals["Gold"])ax.set_xticklabels(medals.index, rotation=90) ax.set_ylabel("Number of medals") plt.show()
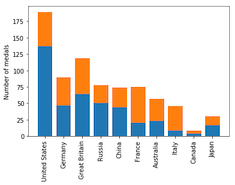
fig, ax = plt.subplots ax.bar(medals.index, medals["Gold"]) ax.bar(medals.index, medals["Silver"], bottom=medals["Gold"])ax.bar(medals.index, medals["Bronze"], bottom=medals["Gold"] + medals["Silver"])ax.set_xticklabels(medals.index, rotation=90) ax.set_ylabel("Number of medals") plt.show()

fig, ax = plt.subplots
ax.bar(medals.index, medals["Gold"])
ax.bar(medals.index, medals["Silver"], bottom=medals["Gold"])
ax.bar(medals.index, medals["Bronze"],
bottom=medals["Gold"] + medals["Silver"])
ax.set_xticklabels(medals.index, rotation=90)
ax.set_ylabel("Number of medals")
fig, ax = plt.subplots ax.bar(medals.index, medals["Gold"], label="Gold") ax.bar(medals.index, medals["Silver"], bottom=medals["Gold"], label="Silver") ax.bar(medals.index, medals["Bronze"], bottom=medals["Gold"] + medals["Silver"], label="Bronze") ax.set_xticklabels(medals.index, rotation=90) ax.set_ylabel("Number of medals")ax.legend() plt.show()

Matplotlib 数据可视化入门