接下来去哪儿
Matplotlib 数据可视化入门

Ariel Rokem
Data Scientist
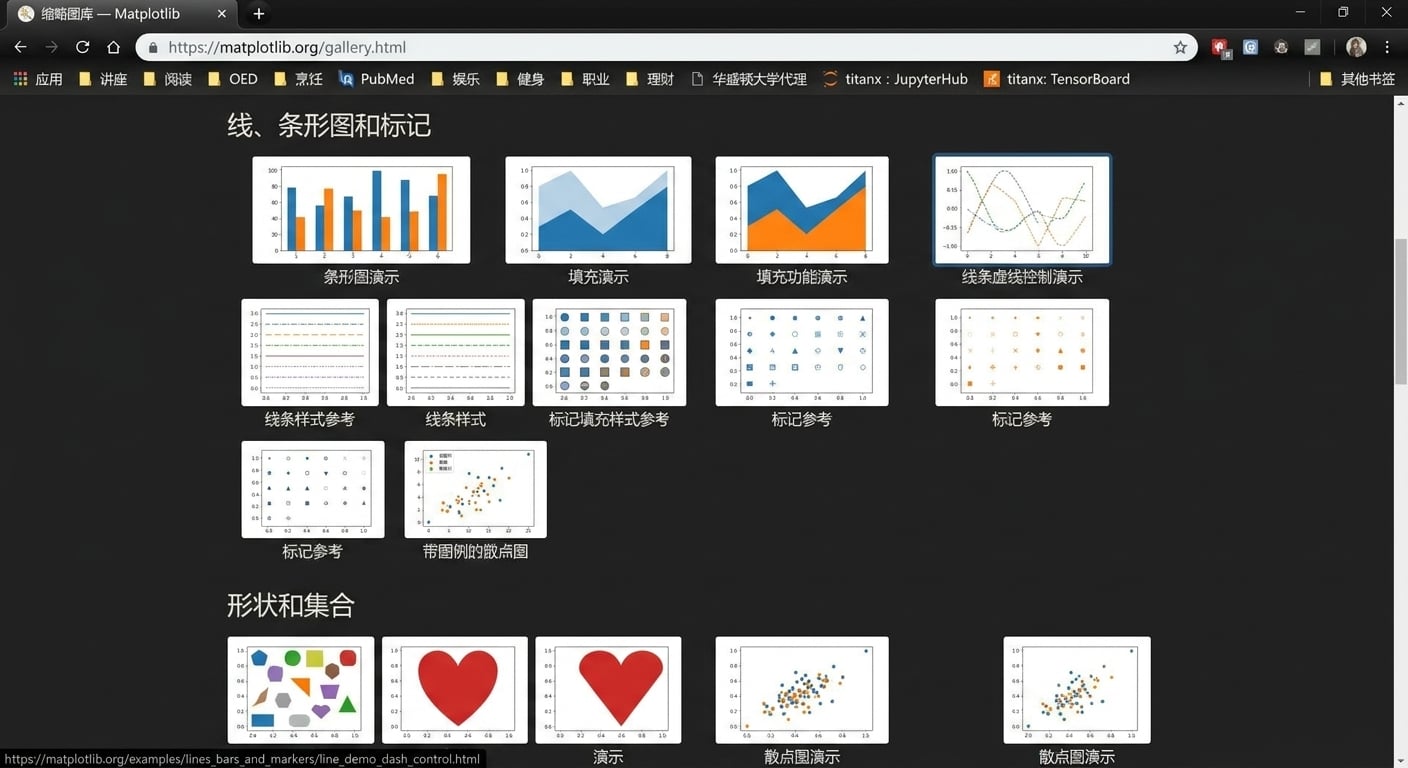
示例画廊
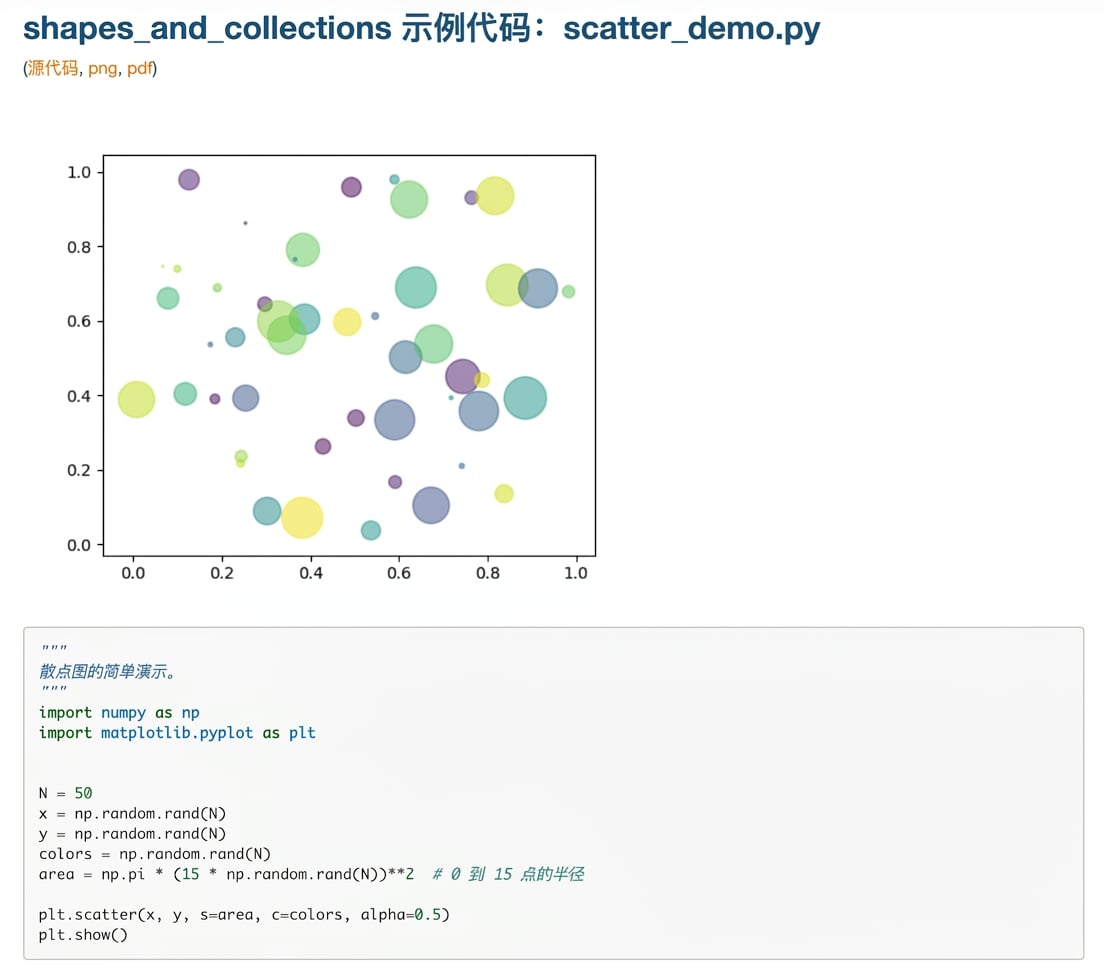
含代码的示例页
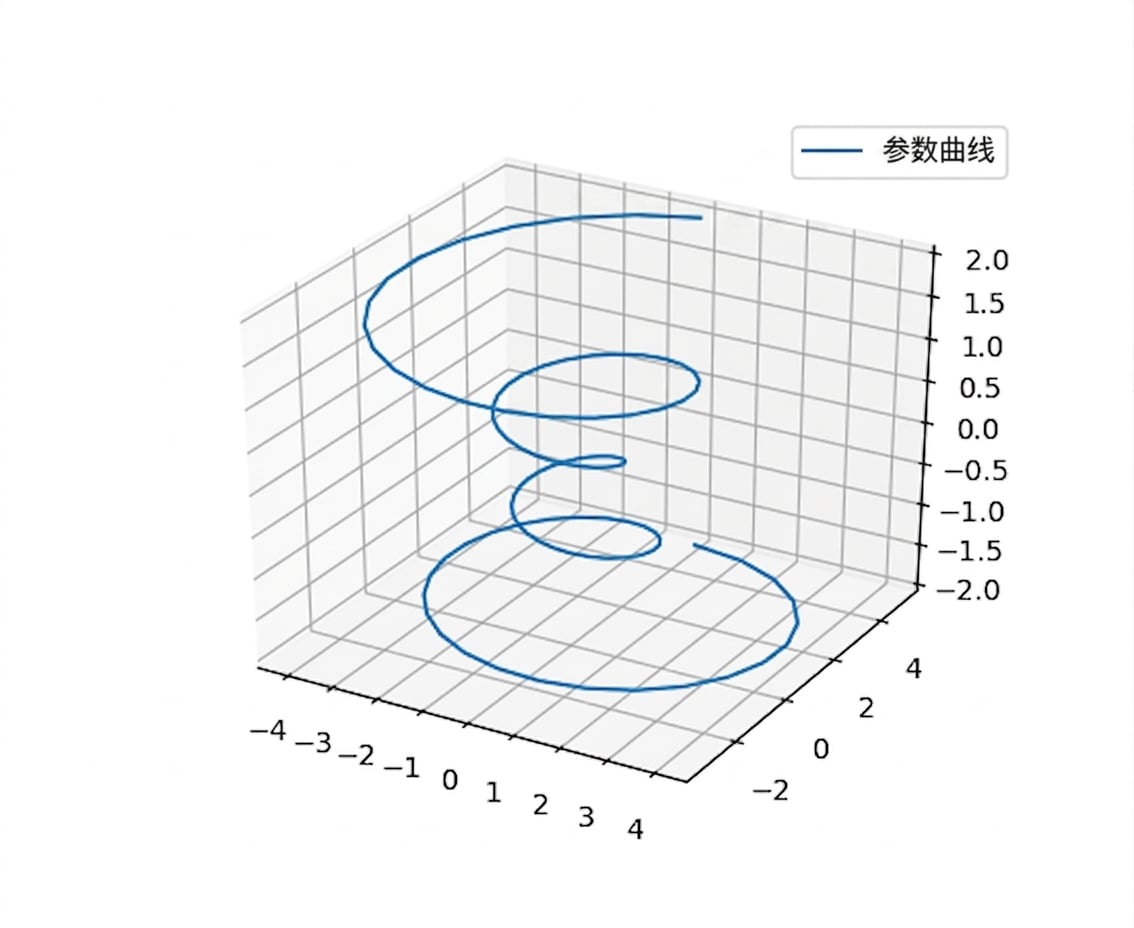
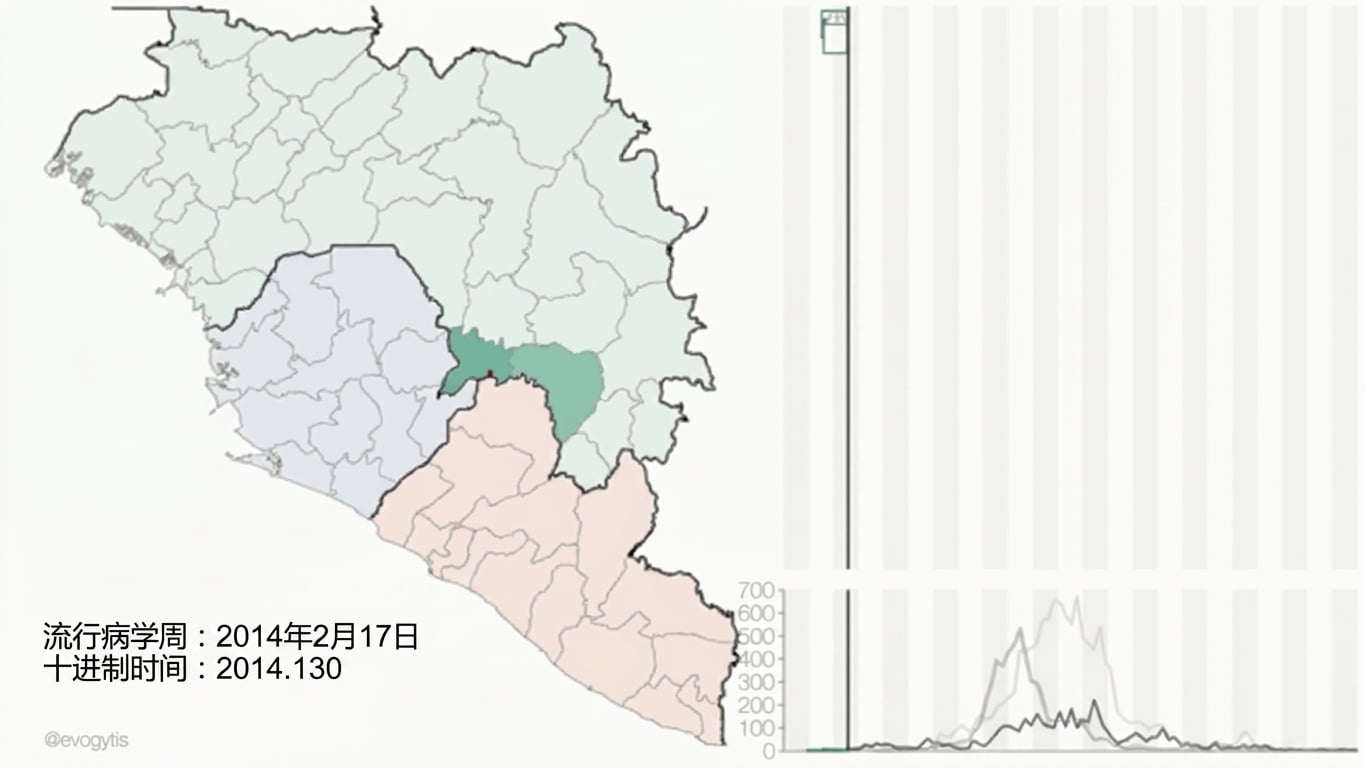
用 Matplotlib 处理地理空间数据

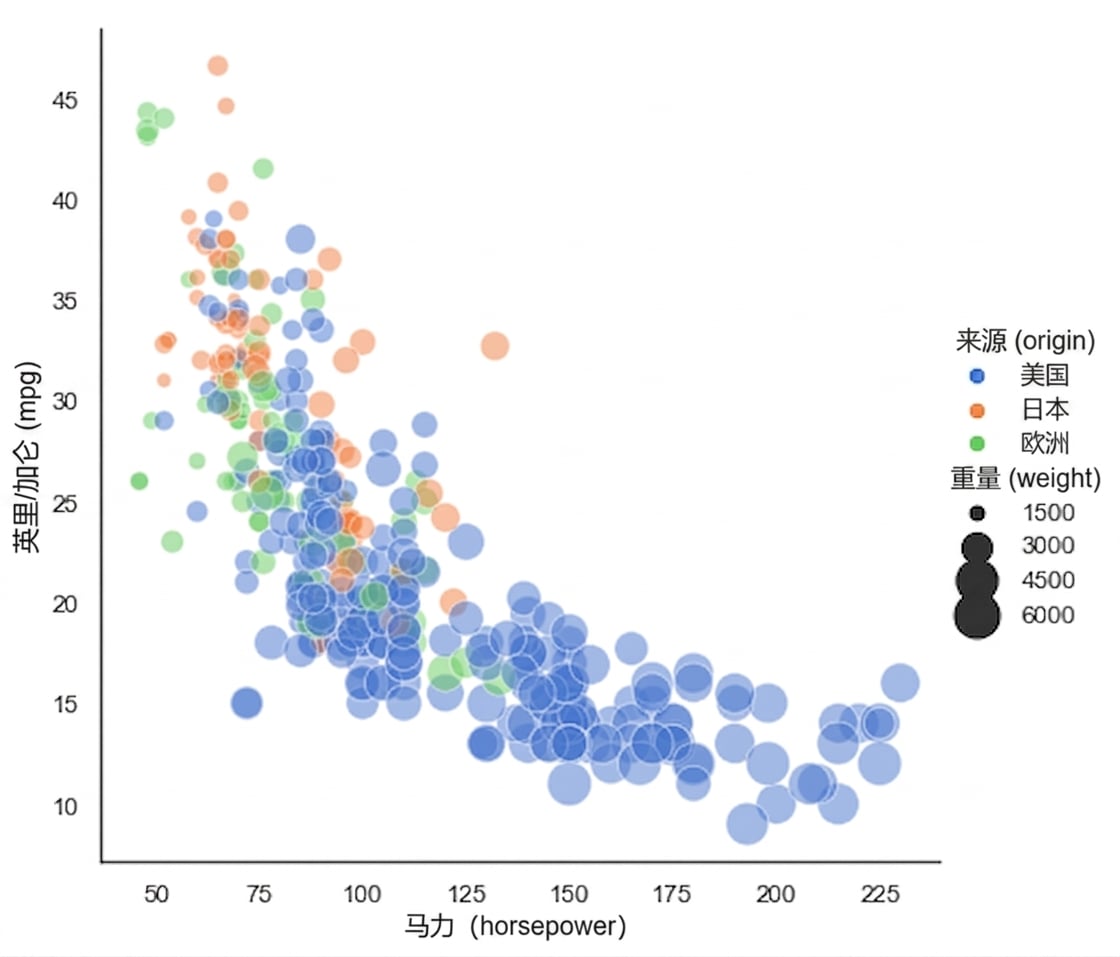
pandas + Matplotlib = Seaborn
seaborn.relplot(x="horsepower", y="mpg", hue="origin", size="weight",
                sizes=(40, 400), alpha=.5, palette="muted",
                height=6, data=mpg)