直方图

Python 金融入门

Adina Howe

Professor

为何在金融分析中使用直方图?
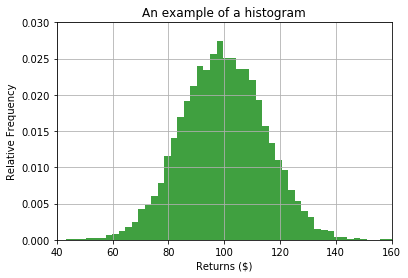
直方图

Python 金融入门

直方图与数据

  • 数据是否偏斜?
  • 是否以均值为中心?
  • 是否有异常点(离群值)?
Python 金融入门

直方图与 matplotlib.pyplot

import matplotlib.pyplot as plt
plt.hist(x=prices, bins=3)
plt.show()
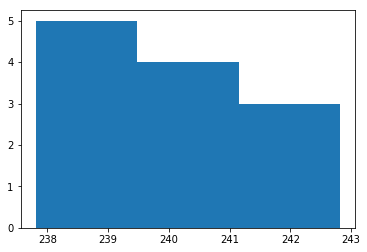
hist1

Python 金融入门

更改箱数(bins)

import matplotlib.pyplot as plt
plt.hist(prices, bins=6)
plt.show()
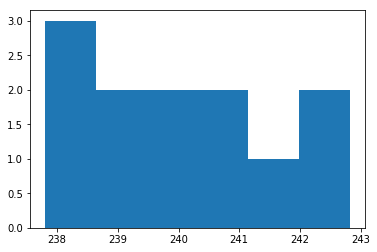
hist2

Python 金融入门

直方图数据归一化

import matplotlib.pyplot as plt
plt.hist(prices, bins=6, density=True)
plt.show()
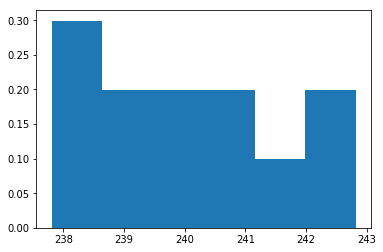
归一化

Python 金融入门

在同一图上叠加直方图

import matplotlib.pyplot as plt
plt.hist(x=prices, bins=6, density=True)
plt.hist(x=prices_new, bins=6, density=True)
plt.show()
Python 金融入门

直方图效果

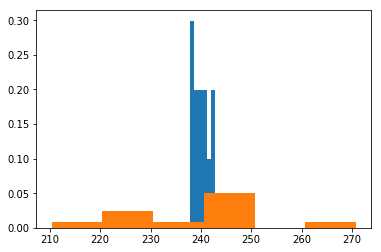
两个归一化直方图

Python 金融入门

Alpha:调整直方图透明度

import matplotlib.pyplot as plt
plt.hist(x=prices, bins=6, density=True, alpha=0.5)
plt.hist(x=prices_new, bins=6, density=True, alpha=0.5)
plt.show()
Python 金融入门

直方图效果

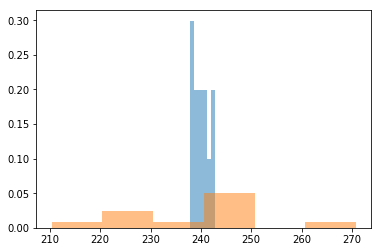
两个半透明直方图

Python 金融入门

添加图例

import matplotlib.pyplot as plt
plt.hist(x=prices, bins=6, density=True, alpha=0.5, label="Prices 1")
plt.hist(x=prices_new, bins=6, density=True, alpha=0.5, label="Prices New")
plt.legend()
plt.show()
Python 金融入门

直方图效果

美观的直方图

Python 金融入门

开始练习吧!

Python 金融入门

Preparing Video For Download...