配对 t 检验
Python 假设检验

James Chapman
Curriculum Manager, DataCamp
美国共和党总统数据集
         state       county  repub_percent_08  repub_percent_12
0      Alabama         Hale         38.957877         37.139882
1     Arkansas       Nevada         56.726272         58.983452
2   California         Lake         38.896719         39.331367
3   California      Ventura         42.923190         45.250693
..         ...          ...               ...               ...
96   Wisconsin    La Crosse         37.490904         40.577038
97   Wisconsin    Lafayette         38.104967         41.675050
98     Wyoming       Weston         76.684241         83.983328
99      Alaska  District 34         77.063259         40.789626

[100 rows x 4 columns]
100 行;每行代表一次总统选举的县级投票。
1 https://dataverse.harvard.edu/dataset.xhtml?persistentId=doi:10.7910/DVN/VOQCHQ
假设
问题:2008 年共和党候选人得票率是否低于 2012 年?
$H_{0}$: $\mu_{2008} - \mu_{2012} = 0$
$H_{A}$: $\mu_{2008} - \mu_{2012} < 0$
设显著性水平 $\alpha = 0.05$。
- 数据为配对 → 每个得票率对应同一县
- 需在模型中体现投票模式
由两样本转为一样本
sample_data = repub_votes_potus_08_12
sample_data['diff'] = sample_data['repub_percent_08'] - sample_data['repub_percent_12']
import matplotlib.pyplot as plt
sample_data['diff'].hist(bins=20)
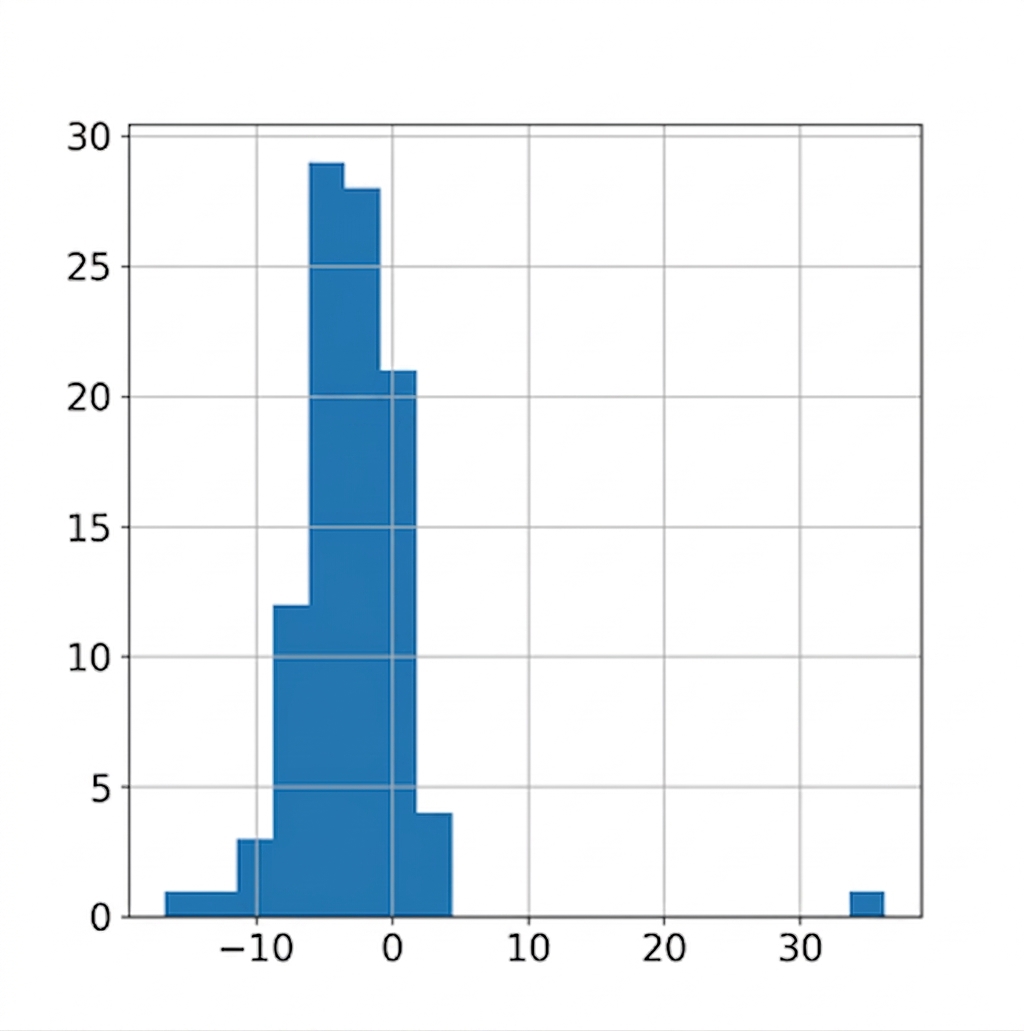
计算差值的样本统计量
xbar_diff = sample_data['diff'].mean()
-2.877109041242944
修订后的假设
旧假设:
$H_{0}$: $\mu_{2008} - \mu_{2012} = 0$
$H_{A}$: $\mu_{2008} - \mu_{2012} < 0$
新假设:
$H_{0}$: $\mu_{\text{diff}} = 0$
$H_{A}$: $ \mu_{\text{diff}} < 0$
$t = \dfrac{\bar{x}_{\text{diff}} - \mu_{\text{diff}}}{\sqrt{\dfrac{s_{diff}^2}{n_{\text{diff}}}}}$
$df = n_{diff} - 1$
计算 p 值
n_diff = len(sample_data)
100
s_diff = sample_data['diff'].std()
t_stat = (xbar_diff-0) / np.sqrt(s_diff**2/n_diff)
-5.601043121928489
degrees_of_freedom = n_diff - 1
99
$t = \dfrac{\bar{x}_{\text{diff}} - \mu_{\text{diff}}}{\sqrt{\dfrac{s_{\text{diff}}^2}{n_{\text{diff}}}}}$
$df = n_{\text{diff}} - 1$
from scipy.stats import t
p_value = t.cdf(t_stat, df=n_diff-1)
9.572537285272411e-08
使用 ttest() 检验两均值差异
import pingouinpingouin.ttest(x=sample_data['diff'],y=0,alternative="less")
               T  dof alternative         p-val          CI95%   cohen-d  \
T-test -5.601043   99        less  9.572537e-08  [-inf, -2.02]  0.560104

             BF10  power
T-test  1.323e+05    1.0
1 有关 pingouin.ttest() 返回值的详细信息,请参阅 pingouin API 文档:https://pingouin-stats.org/generated/pingouin.ttest.html#pingouin.ttest。
ttest() 与 paired=True
pingouin.ttest(x=sample_data['repub_percent_08'],
               y=sample_data['repub_percent_12'],
               paired=True,
               alternative="less")
               T  dof alternative         p-val          CI95%   cohen-d  \
T-test -5.601043   99        less  9.572537e-08  [-inf, -2.02]  0.217364

             BF10     power
T-test  1.323e+05  0.696338
非配对 ttest()
pingouin.ttest(x=sample_data['repub_percent_08'],
               y=sample_data['repub_percent_12'],
               paired=False, # The default
               alternative="less")
               T  dof alternative     p-val         CI95%   cohen-d   BF10  \
T-test -1.536997  198        less  0.062945  [-inf, 0.22]  0.217364  0.927

           power
T-test  0.454972
- 在配对数据上做非配对 t 检验会提高漏检(II 类)错误的概率
Passons à la pratique !
Python 假设检验

