Python 假设检验
James Chapman
Curriculum Manager, DataCamp

对照:

处理:

import pandas as pd
print(stack_overflow)
respondent age_1st_code ... age hobbyist
0 36.0 30.0 ... 34.0 Yes
1 47.0 10.0 ... 53.0 Yes
2 69.0 12.0 ... 25.0 Yes
3 125.0 30.0 ... 41.0 Yes
4 147.0 15.0 ... 28.0 No
... ... ... ... ... ...
2259 62867.0 13.0 ... 33.0 Yes
2260 62882.0 13.0 ... 28.0 Yes
[2261 rows x 8 columns]
一个假设:
数据科学家总体的年薪均值为 $110,000
点估计(样本统计量):
mean_comp_samp = stack_overflow['converted_comp'].mean()
119574.71738168952
import numpy as np# 步骤 3:重复步骤 1 和 2 多次,并追加到列表 so_boot_distn = [] for i in range(5000): so_boot_distn.append(# 步骤 2:计算点估计 np.mean(# 步骤 1:重采样 stack_overflow.sample(frac=1, replace=True)['converted_comp']))
import matplotlib.pyplot as plt
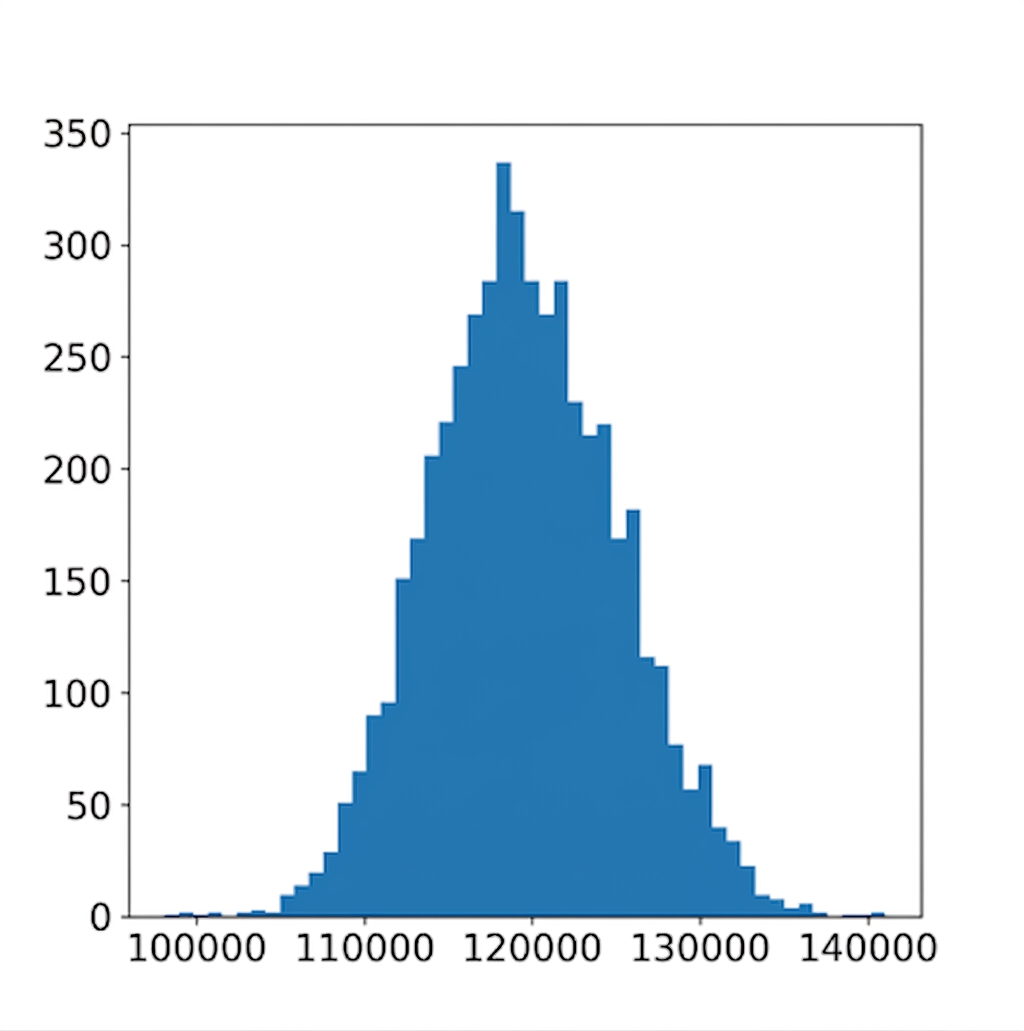
plt.hist(so_boot_distn, bins=50)
plt.show()

std_error = np.std(so_boot_distn, ddof=1)
5607.997577378606
$\text{标准化值} = \dfrac{\text{值} - \text{均值}}{\text{标准差}}$
$z = \dfrac{\text{样本统计量} - \text{假设参数值}}{\text{标准误差}}$
stack_overflow['converted_comp'].mean()
119574.71738168952
mean_comp_hyp = 110000
std_error
5607.997577378606
z_score = (mean_comp_samp - mean_comp_hyp) / std_error
1.7073326529796957
判断样本统计量与期望(或"假设")值是接近还是偏离
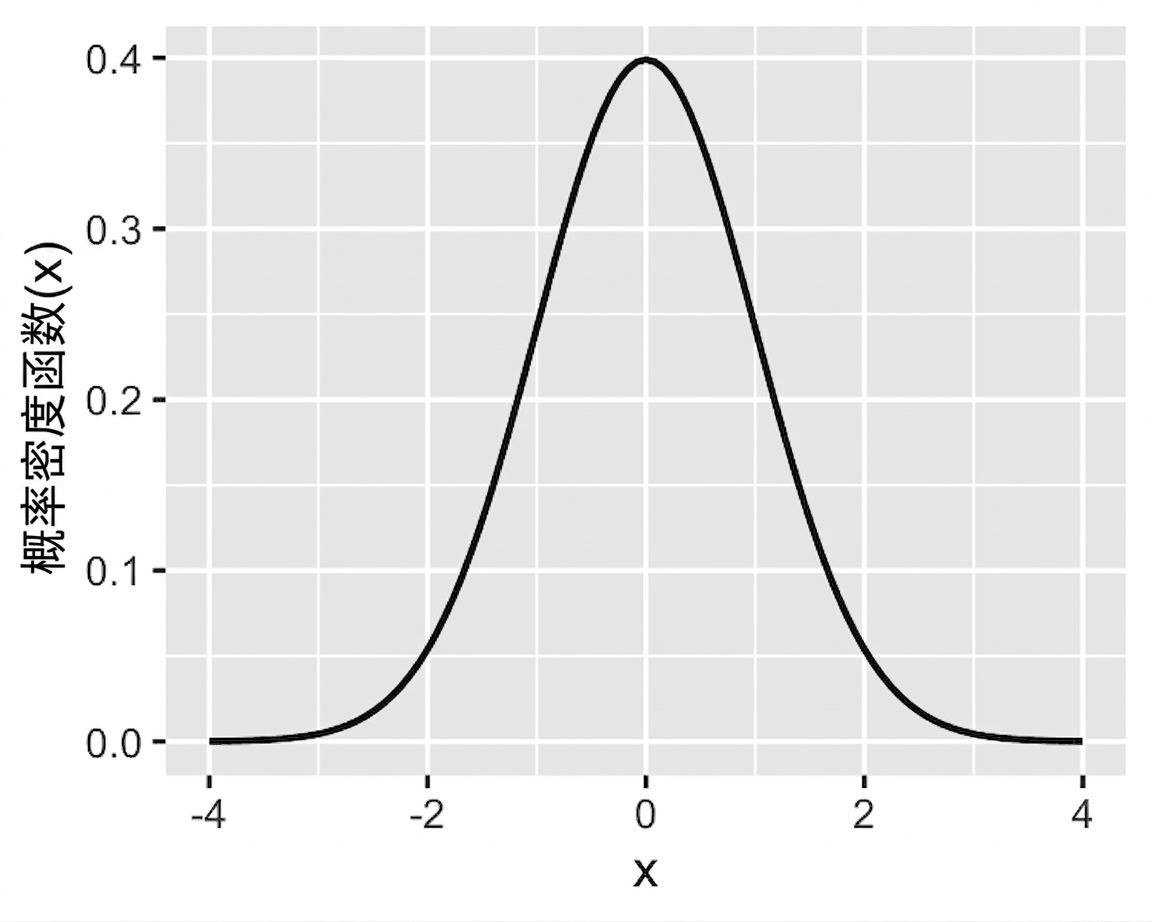
标准正态分布:均值 = 0,标准差 = 1 的正态分布

Python 假设检验