使用 Python 中的 statsmodels 进行回归入门
Maarten Van den Broeck
Content Developer at DataCamp
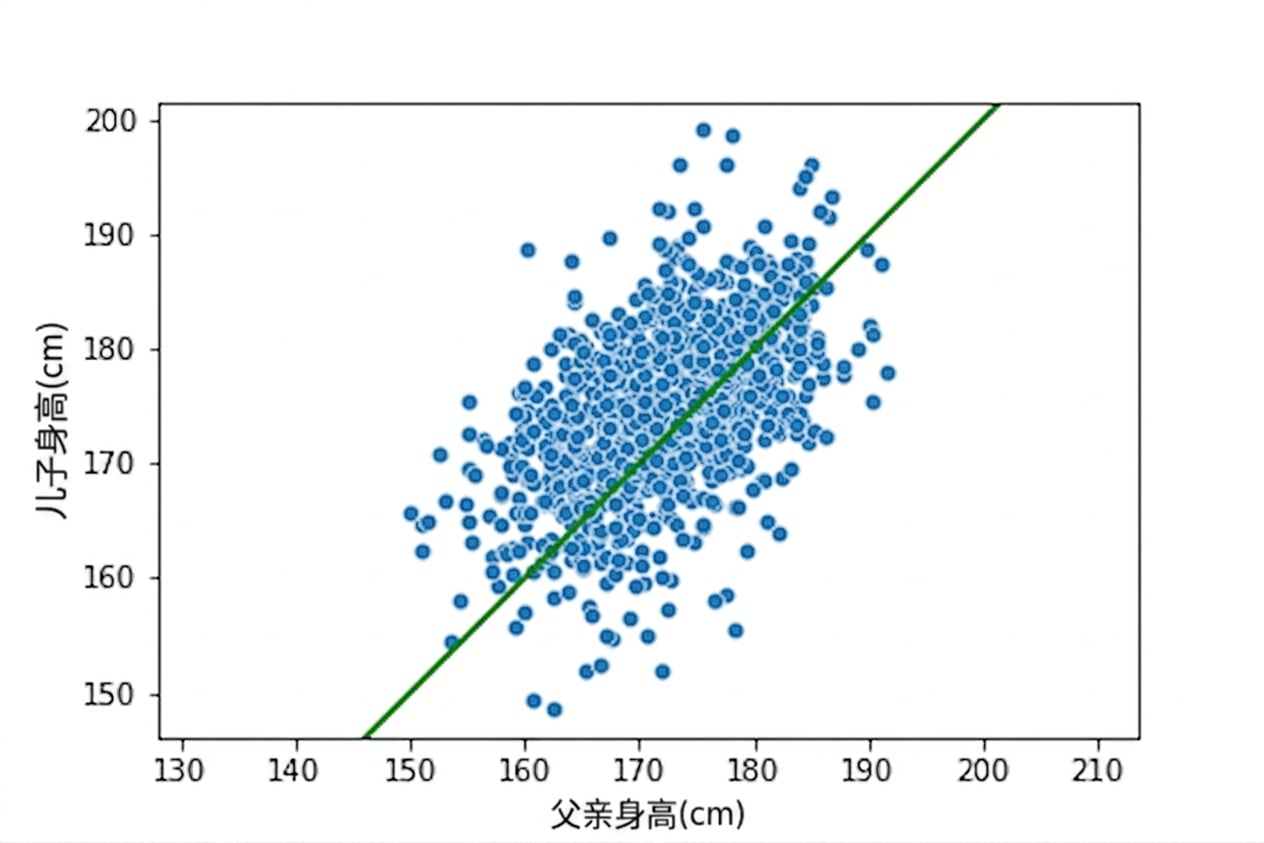
fig = plt.figure()
sns.scatterplot(x="father_height_cm",
                y="son_height_cm",
                data=father_son)
plt.axline(xy1=(150, 150),
           slope=1,
           linewidth=2,
           color="green")
plt.axis("equal")
plt.show()
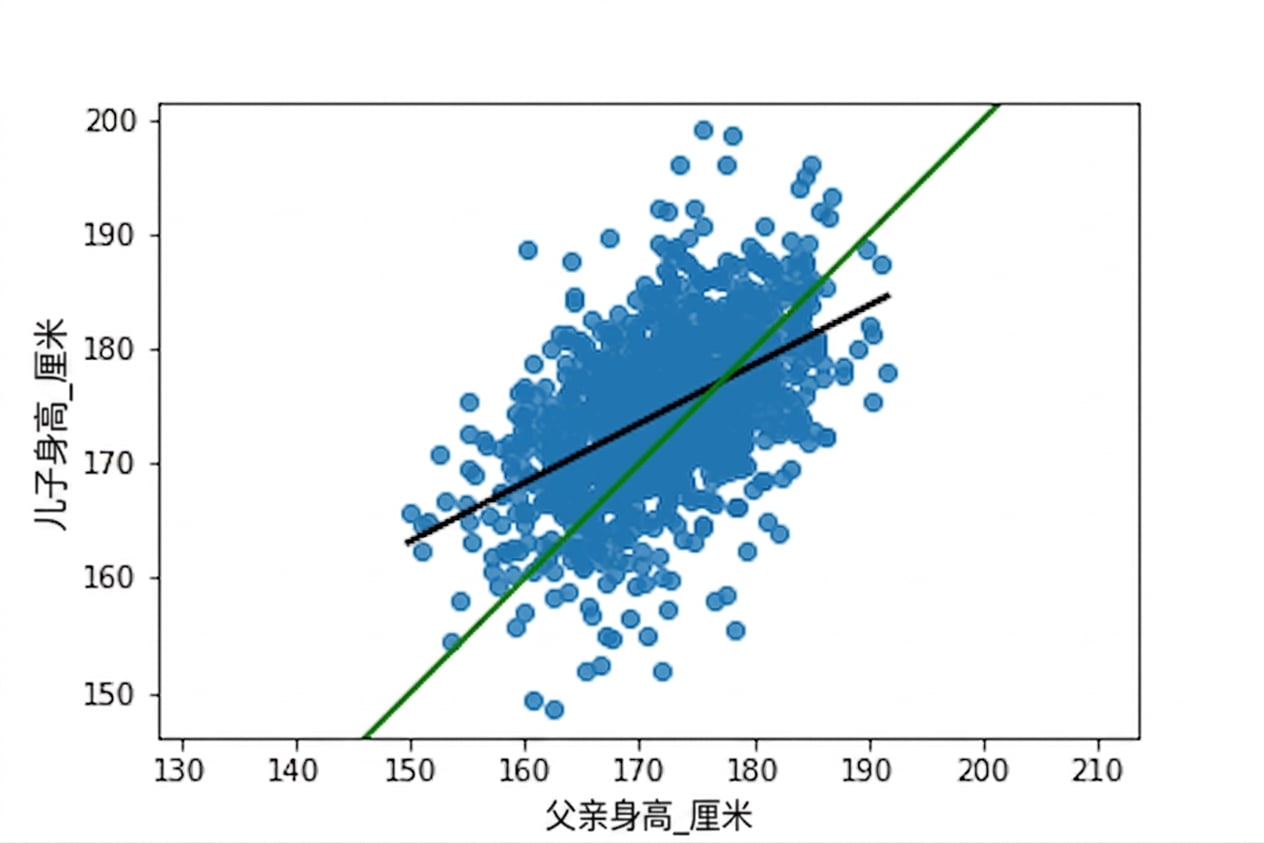
fig = plt.figure()

sns.regplot(x="father_height_cm",
            y="son_height_cm",
            data=father_son,
            ci = None,
            line_kws={"color": "black"})

plt.axline(xy1 = (150, 150),
           slope=1,
           linewidth=2,
           color="green")

plt.axis("equal")
plt.show()
mdl_son_vs_father = ols("son_height_cm ~ father_height_cm",
                        data = father_son).fit()
print(mdl_son_vs_father.params)
Intercept           86.071975
father_height_cm     0.514093
dtype: float64
really_tall_father = pd.DataFrame(
  {"father_height_cm": [190]})

mdl_son_vs_father.predict(
  really_tall_father)
183.7
really_short_father = pd.DataFrame(
  {"father_height_cm": [150]})

mdl_son_vs_father.predict(
  really_short_father)
163.2