使用 Python 中的 statsmodels 进行回归入门
Maarten Van den Broeck
Content Developer at DataCamp
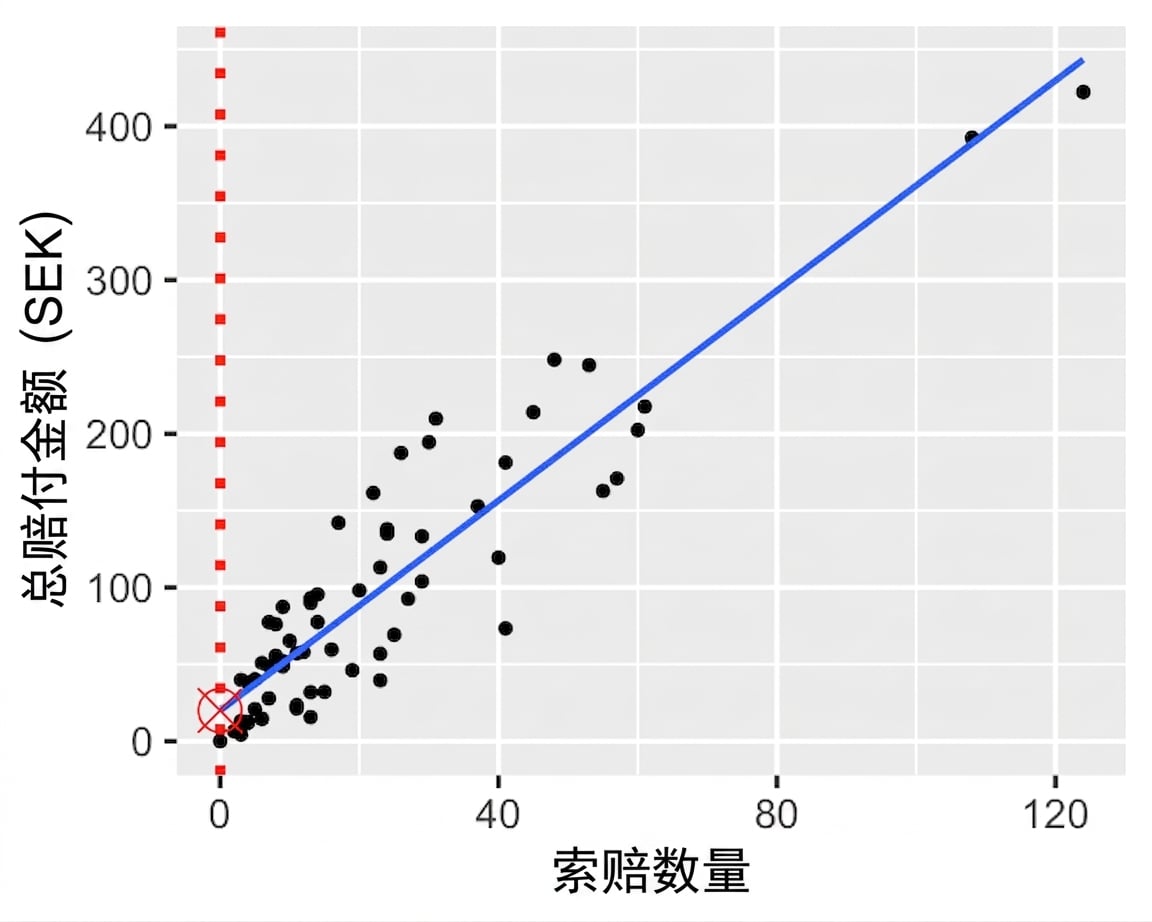
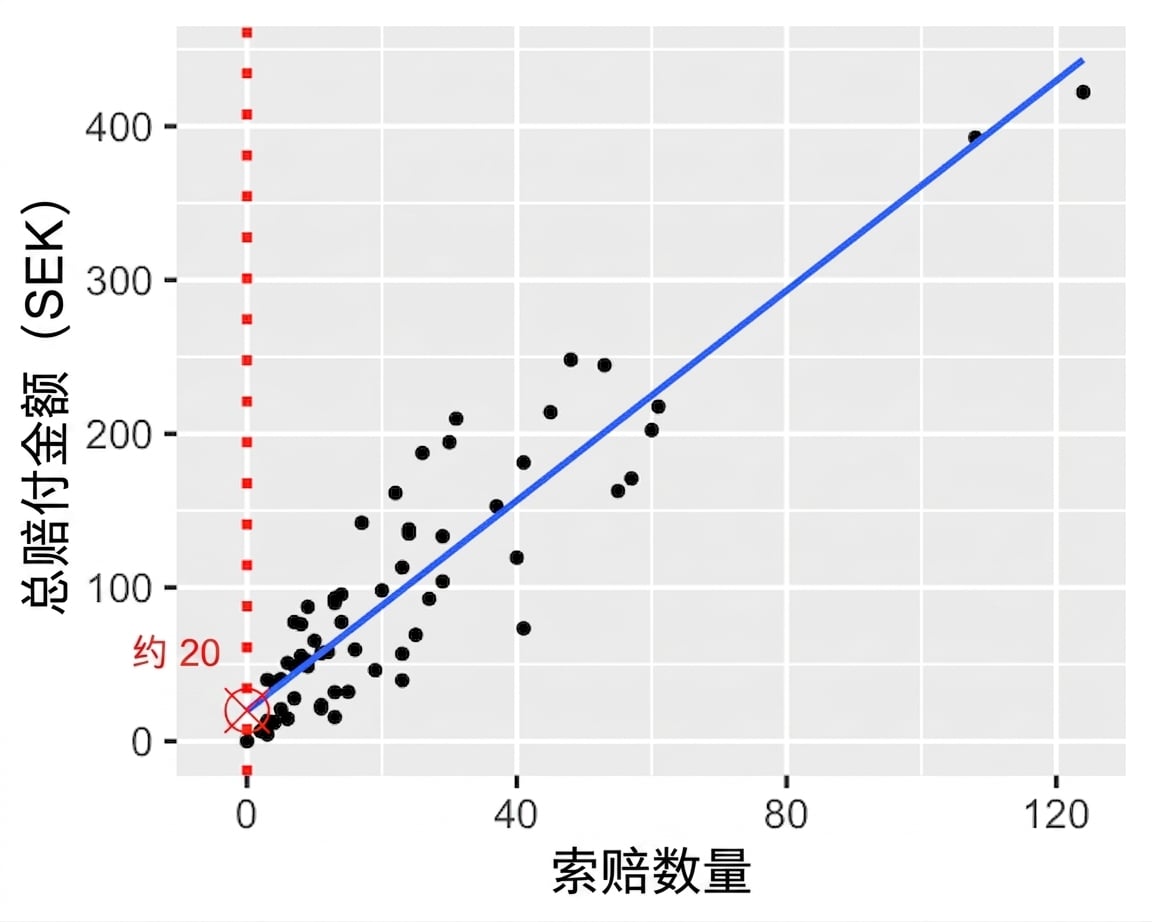
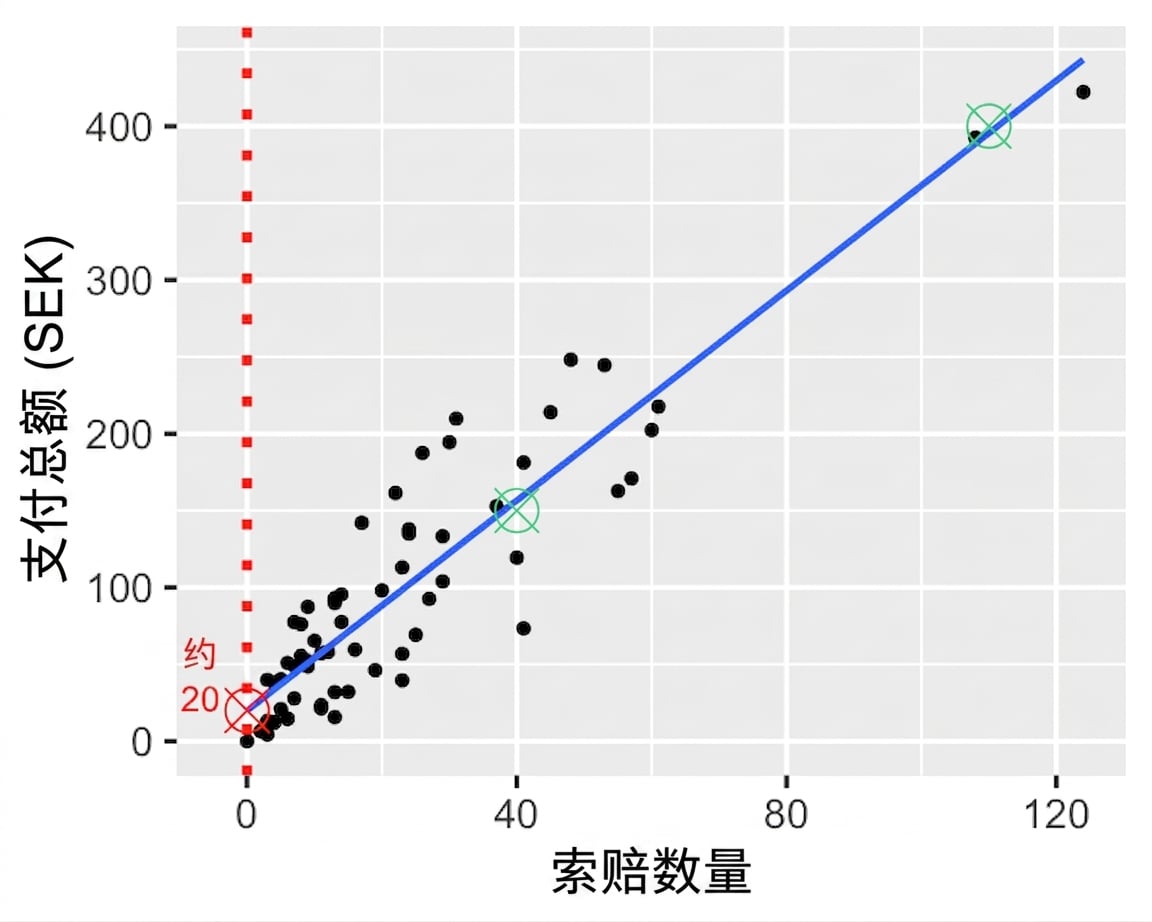
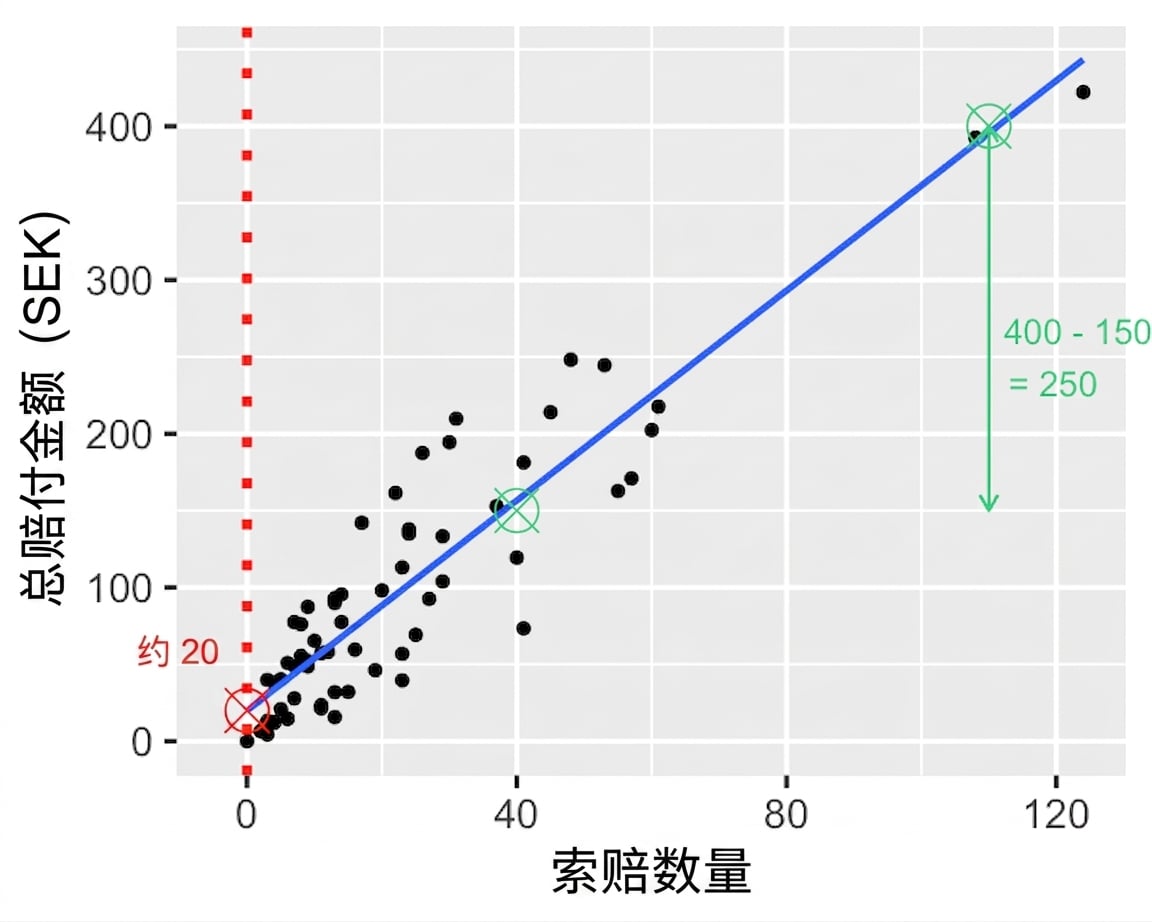
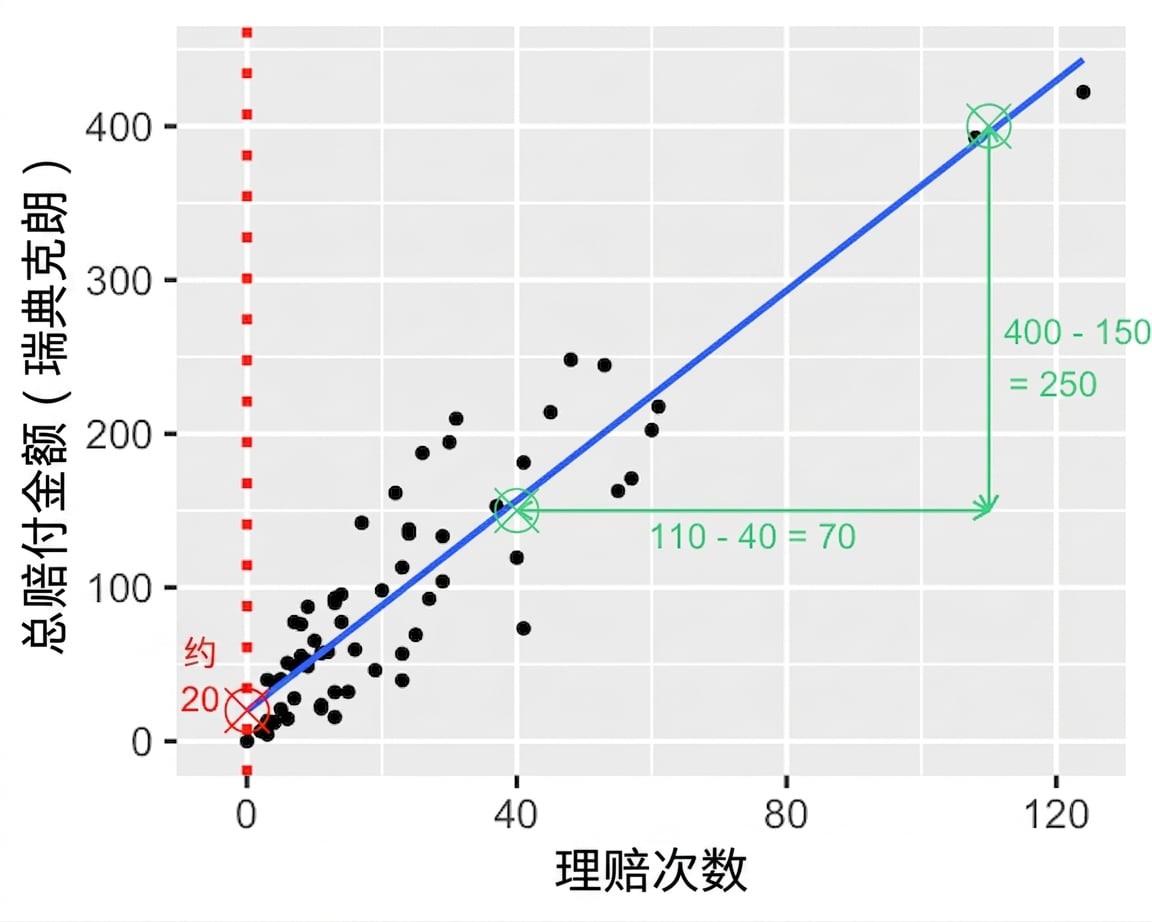
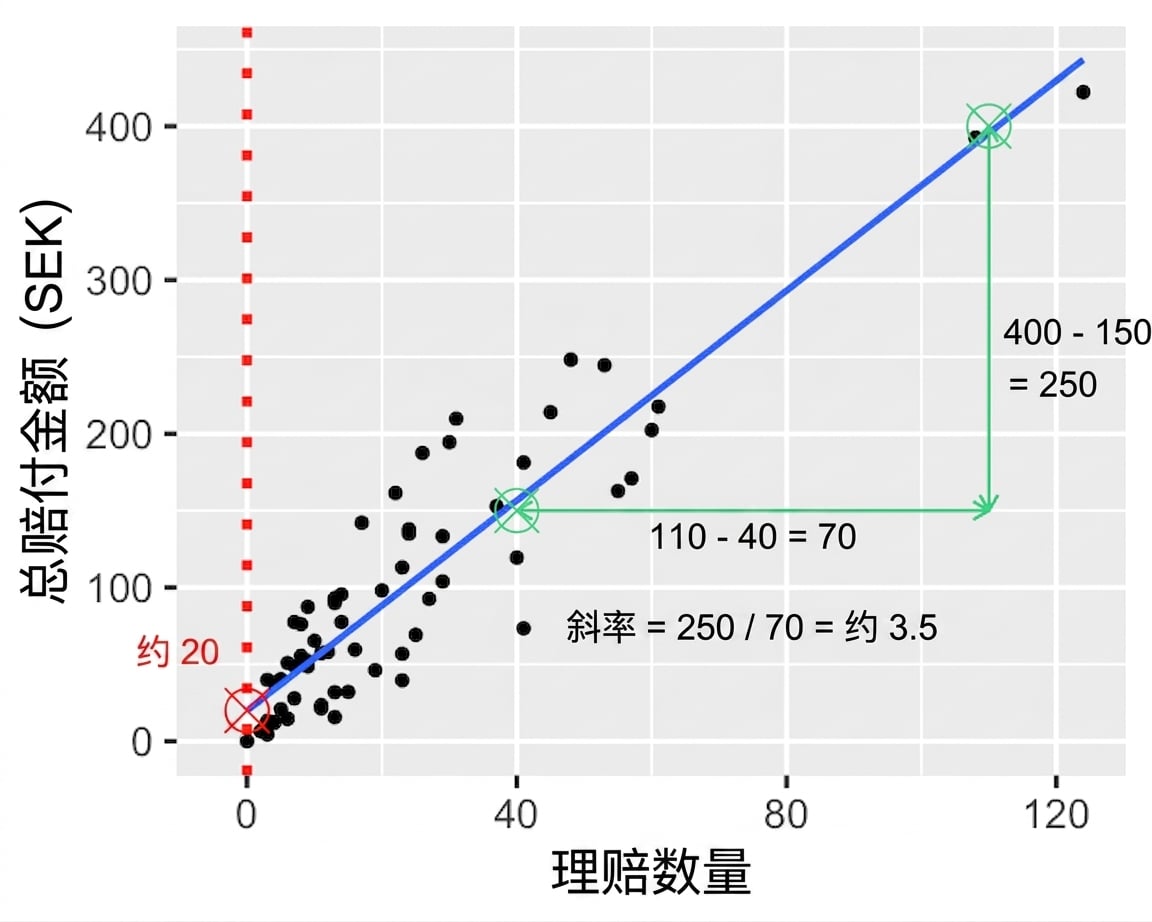
当 $x$ 为 0 时的 $y$ 值。
$x$ 每增加 1,$y$ 增加的量。
$y = \text{intercept} + \text{slope} * x$
from statsmodels.formula.api import ols

mdl_payment_vs_claims = ols("total_payment_sek ~ n_claims",
                            data=swedish_motor_insurance)


mdl_payment_vs_claims = mdl_payment_vs_claims.fit()

print(mdl_payment_vs_claims.params)
from statsmodels.formula.api import ols
mdl_payment_vs_claims = ols("total_payment_sek ~ n_claims", data=swedish_motor_insurance)
mdl_payment_vs_claims = mdl_payment_vs_claims.fit()
print(mdl_payment_vs_claims.params)
Intercept    19.994486
n_claims      3.413824
dtype: float64
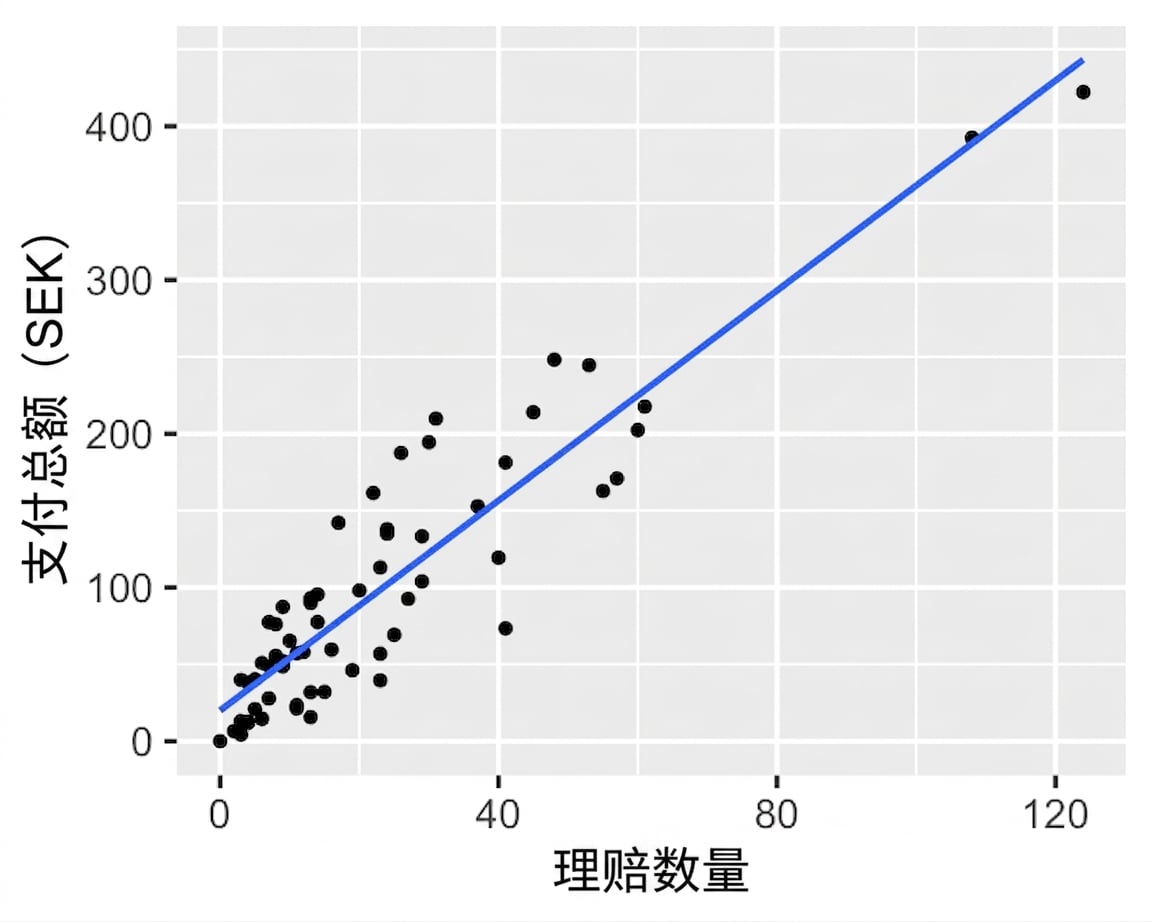
$\text{total\_payment\_sek} = 19.99 + 3.41 * \text{n\_claims}$