两个变量的故事

使用 Python 中的 statsmodels 进行回归入门

Maarten Van den Broeck

Content Developer at DataCamp

瑞典机动车保险数据

  • 每行代表瑞典的一个地理区域。
  • 共63行。
n_claims total_payment_sek
108 392.5
19 46.2
13 15.7
124 422.2
40 119.4
... ...
使用 Python 中的 statsmodels 进行回归入门

描述性统计

import pandas as pd
print(swedish_motor_insurance.mean())
n_claims             22.904762
total_payment_sek    98.187302
dtype: float64
print(swedish_motor_insurance['n_claims'].corr(swedish_motor_insurance['total_payment_sek']))
0.9128782350234068
使用 Python 中的 statsmodels 进行回归入门

什么是回归?

  • 用统计模型探索响应变量与解释变量的关系。
  • 给定解释变量,可预测响应变量的值。
n_claims total_payment_sek
108 3925
19 462
13 157
124 4222
40 1194
200 ???
使用 Python 中的 statsmodels 进行回归入门

术语

响应变量(又称因变量)

你要预测的变量。

解释变量(又称自变量)

用于解释响应变量如何变化的变量。

使用 Python 中的 statsmodels 进行回归入门

线性回归与逻辑回归

线性回归

  • 响应变量为数值型。

逻辑回归

  • 响应变量为布尔型。

简单线性/逻辑回归

  • 只有一个解释变量。
使用 Python 中的 statsmodels 进行回归入门

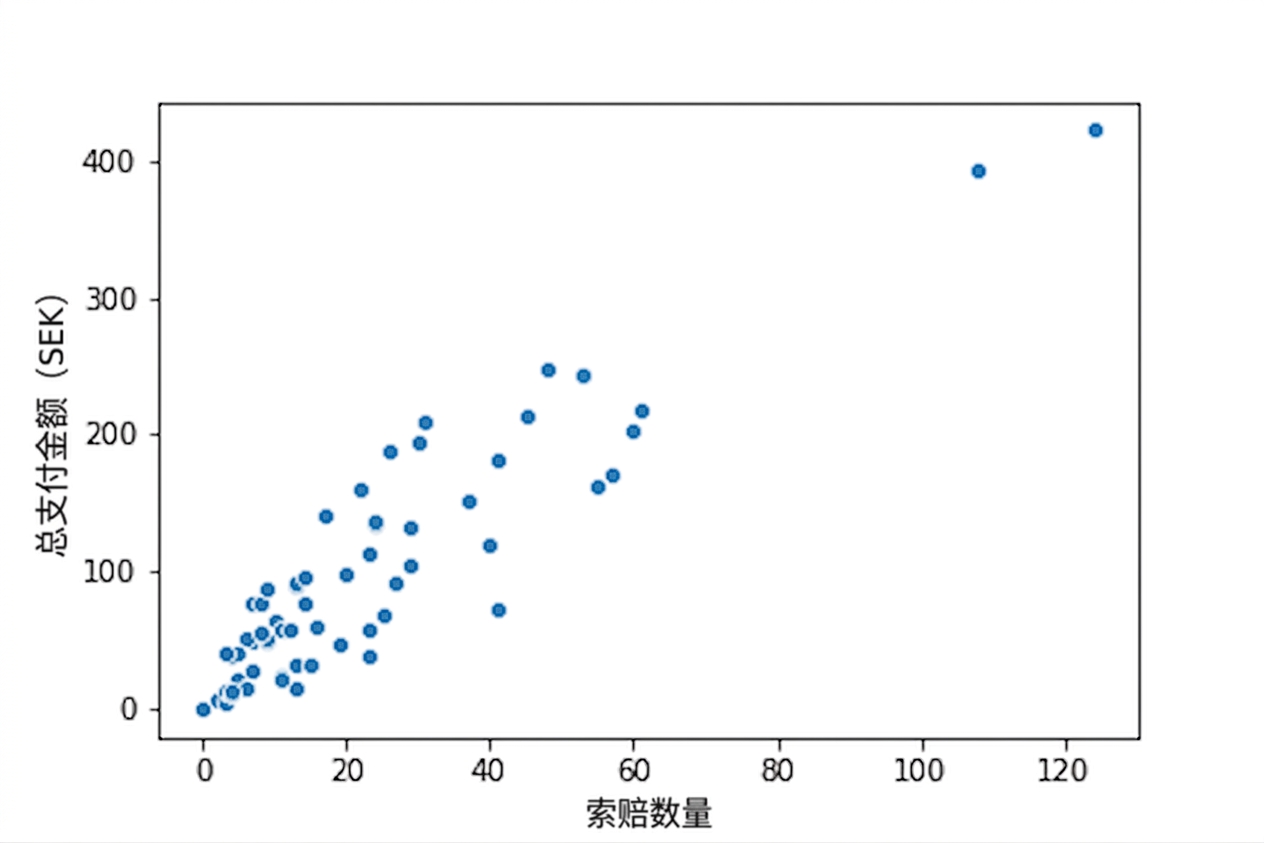
可视化变量对

import matplotlib.pyplot as plt
import seaborn as sns

sns.scatterplot(x="n_claims",
                y="total_payment_sek",    
                data=swedish_motor_insurance)

plt.show()

总赔付额与理赔次数的散点图。理赔次数越多,总赔付额越高。

使用 Python 中的 statsmodels 进行回归入门

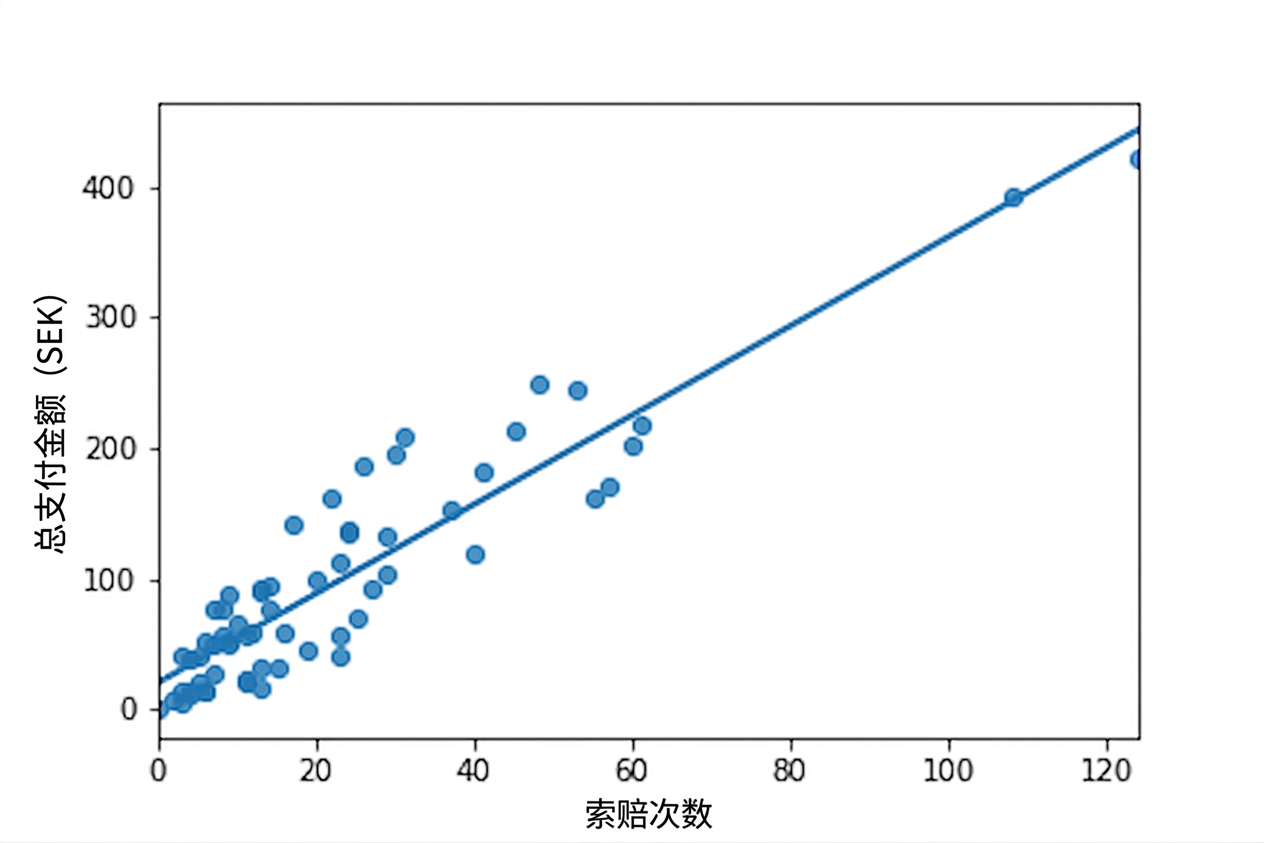
添加线性趋势线

sns.regplot(x="n_claims",
            y="total_payment_sek",
            data=swedish_motor_insurance,
            ci=None)

同一散点图,加入通过线性回归计算的趋势线,对数据拟合良好。

使用 Python 中的 statsmodels 进行回归入门

课程流程

第1章

线性回归的可视化与拟合。

第2章

用线性回归做预测并理解模型系数。

第3章

评估线性回归模型质量。

第4章

对逻辑回归做同样的流程。

使用 Python 中的 statsmodels 进行回归入门

Python 回归工具包

statsmodels

  • 侧重洞察(本课使用)

scikit-learn

  • 侧重预测(见其他 DataCamp 课程)
使用 Python 中的 statsmodels 进行回归入门

让我们来练习吧!

使用 Python 中的 statsmodels 进行回归入门

Preparing Video For Download...