使用 Python 中的 statsmodels 进行回归入门
Maarten Van den Broeck
Content Developer at DataCamp
bream = fish[fish["species"] == "Bream"]
print(bream.head())
  species  mass_g  length_cm
0   Bream   242.0       23.2
1   Bream   290.0       24.0
2   Bream   340.0       23.9
3   Bream   363.0       26.3
4   Bream   430.0       26.5
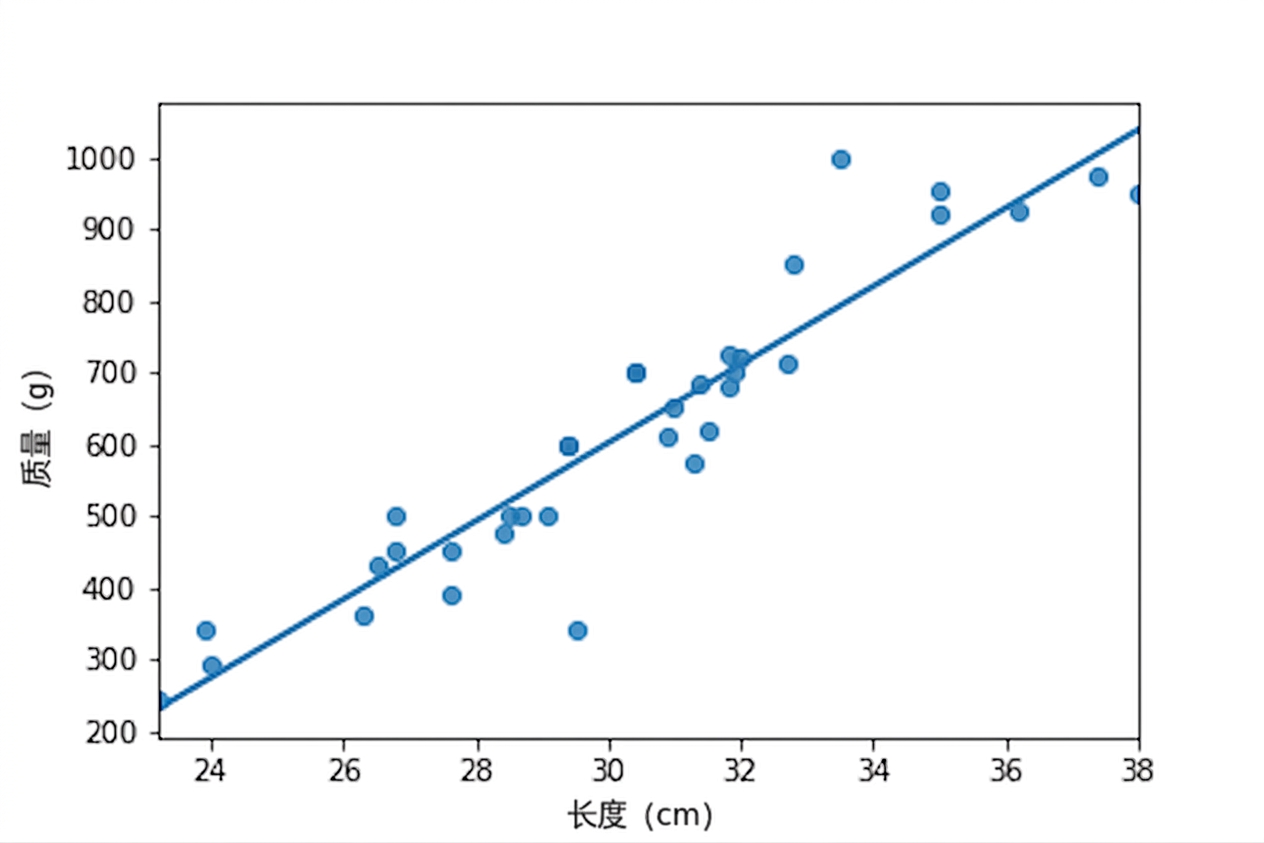
sns.regplot(x="length_cm",
            y="mass_g",
            data=bream,
            ci=None)

plt.show()
mdl_mass_vs_length = ols("mass_g ~ length_cm", data=bream).fit()

print(mdl_mass_vs_length.params)
mdl_mass_vs_length = ols("mass_g ~ length_cm", data=bream).fit()
print(mdl_mass_vs_length.params)
Intercept   -1035.347565
length_cm      54.549981
dtype: float64
如果自变量取这些值,因变量会是什么值?
explanatory_data = pd.DataFrame({"length_cm": np.arange(20, 41)})
    length_cm
0          20
1          21
2          22
3          23
4          24
5          25
     ...
print(mdl_mass_vs_length.predict(explanatory_data))
0       55.652054
1      110.202035
2      164.752015
3      219.301996
4      273.851977
    ...
16     928.451749
17     983.001730
18    1037.551710
19    1092.101691
20    1146.651672
Length: 21, dtype: float64
explanatory_data = pd.DataFrame(
  {"length_cm": np.arange(20, 41)}
)

prediction_data = explanatory_data.assign(
    mass_g=mdl_mass_vs_length.predict(explanatory_data)
)

print(prediction_data)
explanatory_data = pd.DataFrame( {"length_cm": np.arange(20, 41)} )
prediction_data = explanatory_data.assign( mass_g=mdl_mass_vs_length.predict(explanatory_data) )
print(prediction_data)
    length_cm         mass_g
0          20      55.652054
1          21     110.202035
2          22     164.752015
3          23     219.301996
4          24     273.851977
..        ...            ...
16         36     928.451749
17         37     983.001730
18         38    1037.551710
19         39    1092.101691
20         40    1146.651672
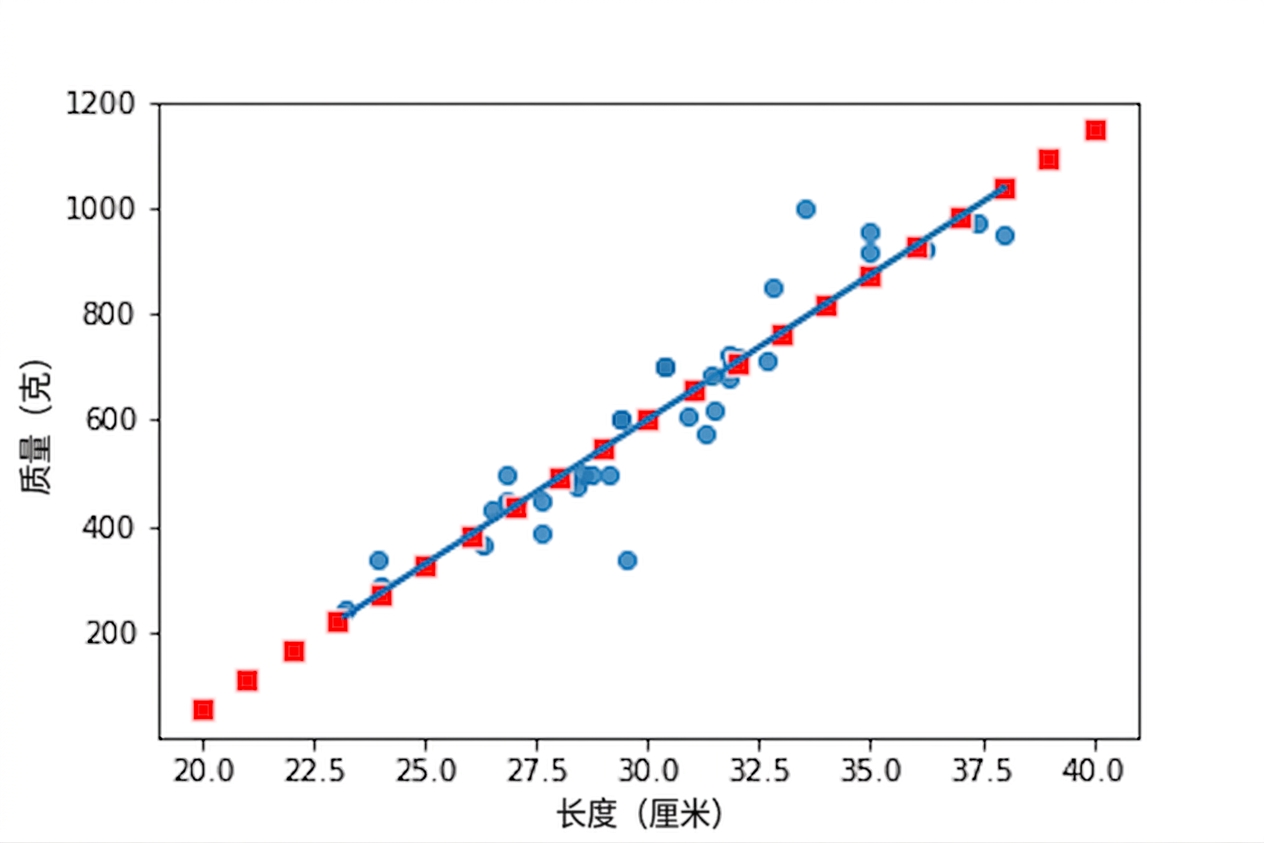
import matplotlib.pyplot as plt
import seaborn as sns
fig = plt.figure()
sns.regplot(x="length_cm",
            y="mass_g",
            ci=None,
            data=bream,)
sns.scatterplot(x="length_cm",
                y="mass_g",
                data=prediction_data,
                color="red",
                marker="s")
plt.show()
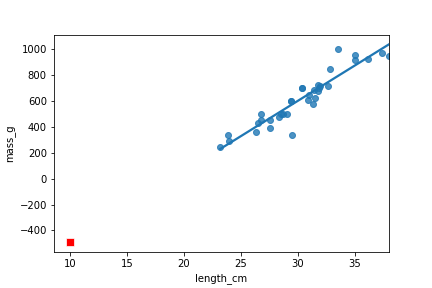
外推 指在观测数据范围之外进行预测。
little_bream = pd.DataFrame({"length_cm": [10]})

pred_little_bream = little_bream.assign(
    mass_g=mdl_mass_vs_length.predict(little_bream))

print(pred_little_bream)
   length_cm      mass_g
0         10 -489.847756