使用 Python 中的 statsmodels 进行回归入门
Maarten Van den Broeck
Content Developer at DataCamp
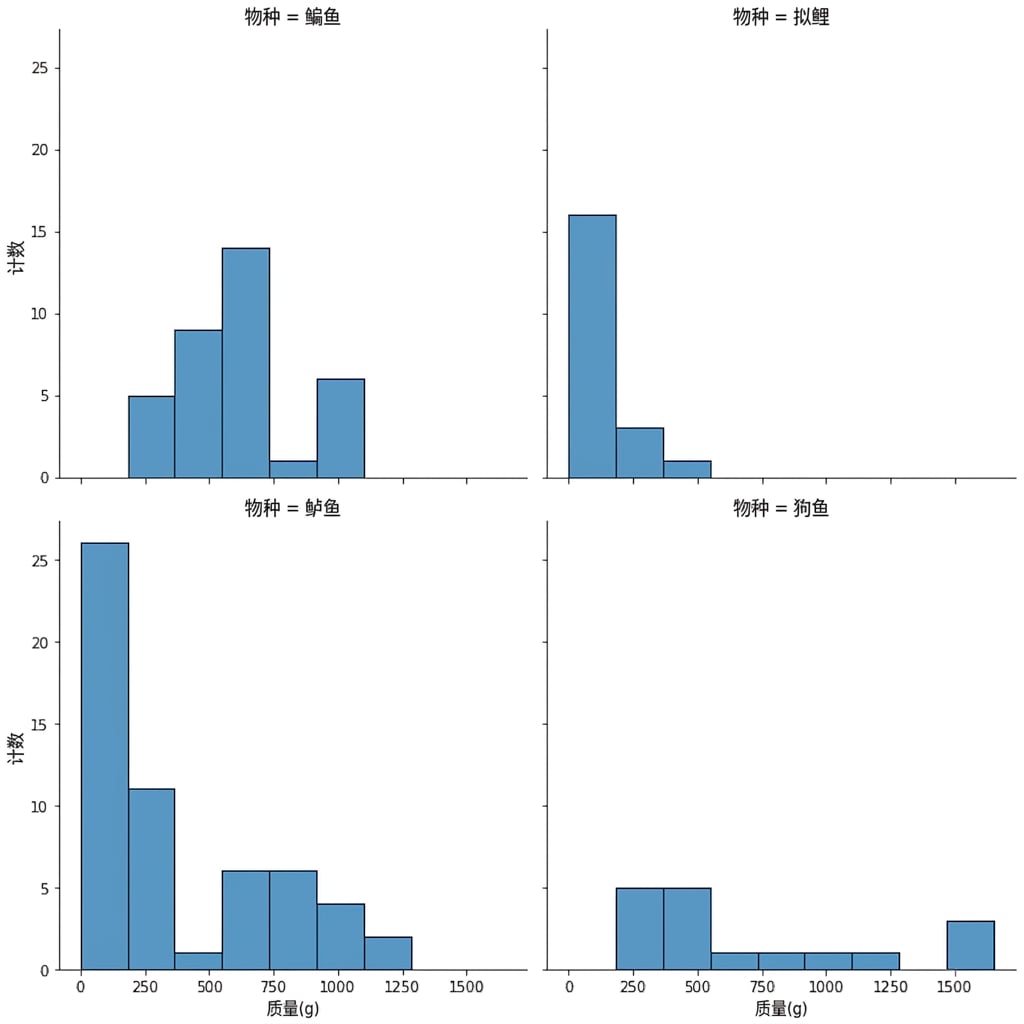
import matplotlib.pyplot as plt
import seaborn as sns

sns.displot(data=fish,
            x="mass_g",
            col="species",
            col_wrap=2,
            bins=9)

plt.show()
summary_stats = fish.groupby("species")["mass_g"].mean()
print(summary_stats)
species
Bream    617.828571
Perch    382.239286
Pike     718.705882
Roach    152.050000
Name: mass_g, dtype: float64
from statsmodels.formula.api import ols
mdl_mass_vs_species = ols("mass_g ~ species", data=fish).fit()

print(mdl_mass_vs_species.params)
from statsmodels.formula.api import ols mdl_mass_vs_species = ols("mass_g ~ species", data=fish).fit()
print(mdl_mass_vs_species.params)
Intercept           617.828571
species[T.Perch]   -235.589286
species[T.Pike]     100.877311
species[T.Roach]   -465.778571
上一页的含截距模型
mdl_mass_vs_species = ols(
  "mass_g ~ species", data=fish).fit()

print(mdl_mass_vs_species.params)
mdl_mass_vs_species = ols( "mass_g ~ species", data=fish).fit()
系数相对于截距: $617.83 - 235.59 = 382.24!$
无截距模型
mdl_mass_vs_species = ols(
  "mass_g ~ species + 0", data=fish).fit()

print(mdl_mass_vs_species.params)
mdl_mass_vs_species = ols( "mass_g ~ species + 0", data=fish).fit()
species[Bream]    617.828571
species[Perch]    382.239286
species[Pike]     718.705882
species[Roach]    152.050000
单个分类变量时, 系数就是各组均值。