离群点、杠杆值与影响力

使用 Python 中的 statsmodels 进行回归入门

Maarten Van den Broeck

Content Developer at DataCamp

Roach 数据集
roach = fish[fish['species'] == "Roach"]
print(roach.head())
   species  mass_g  length_cm
35   Roach    40.0       12.9
36   Roach    69.0       16.5
37   Roach    78.0       17.5
38   Roach    87.0       18.2
39   Roach   120.0       18.6

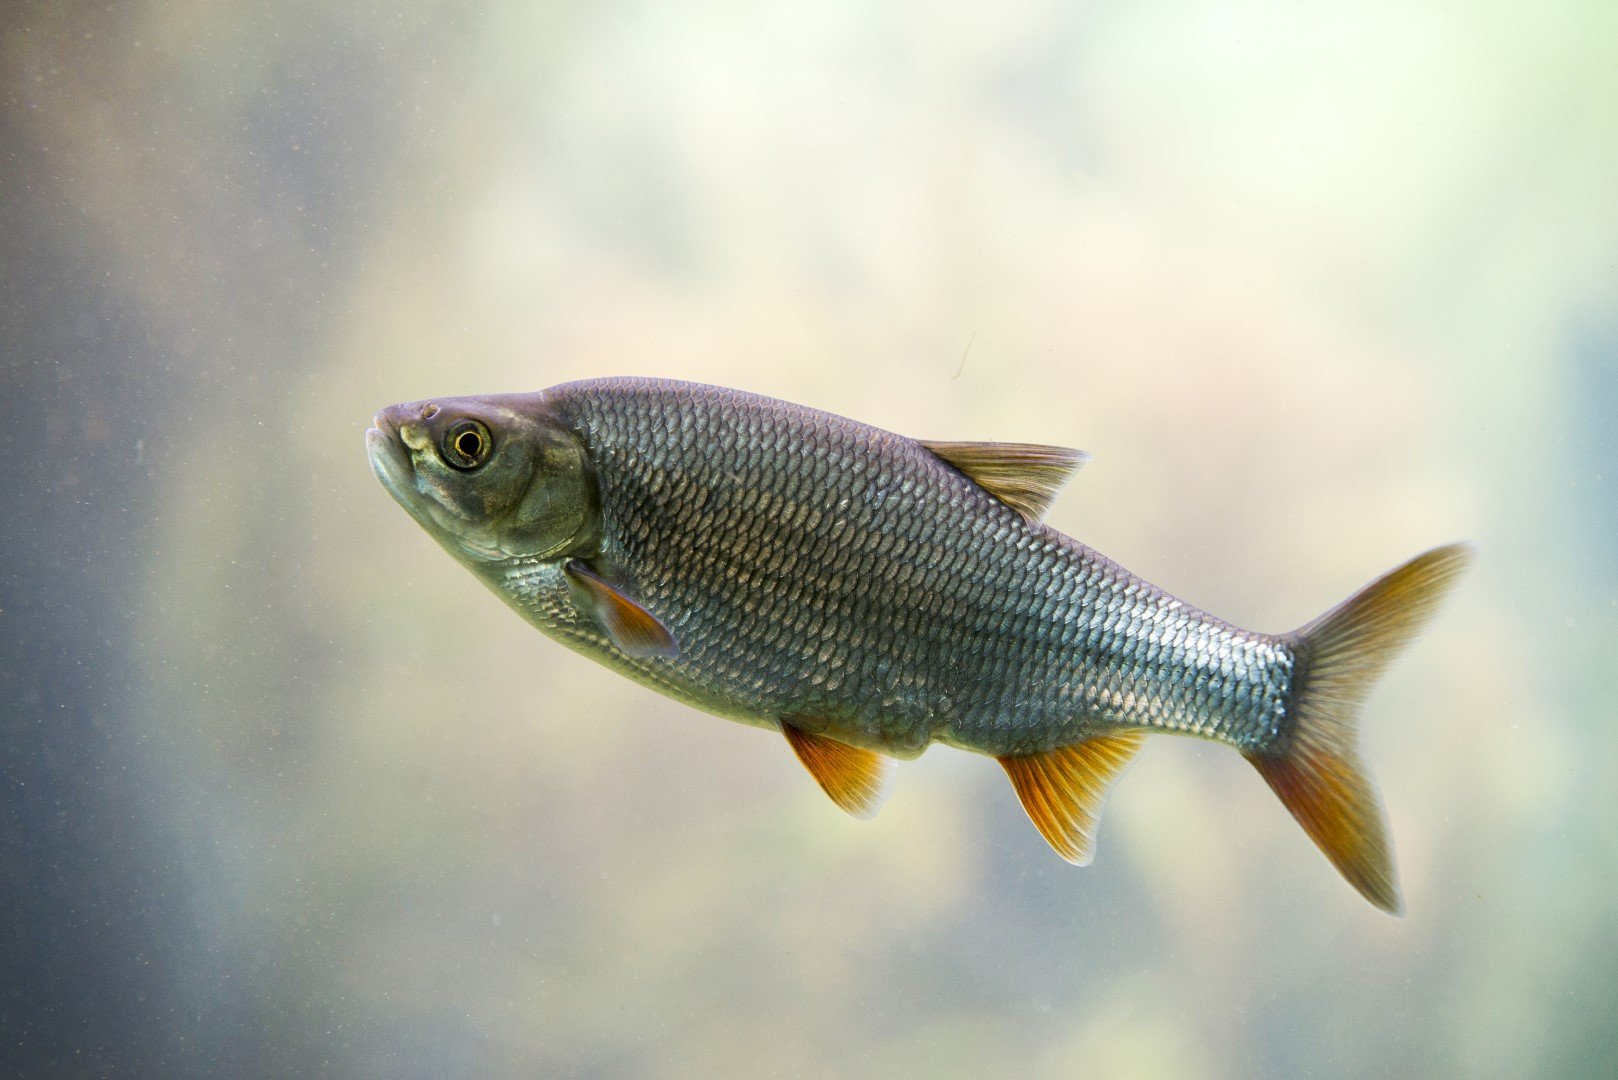
一种常见鲫鱼(roach)

使用 Python 中的 statsmodels 进行回归入门

哪些点是离群点?

sns.regplot(x="length_cm",
            y="mass_g",
            data=roach,
            ci=None)
plt.show()

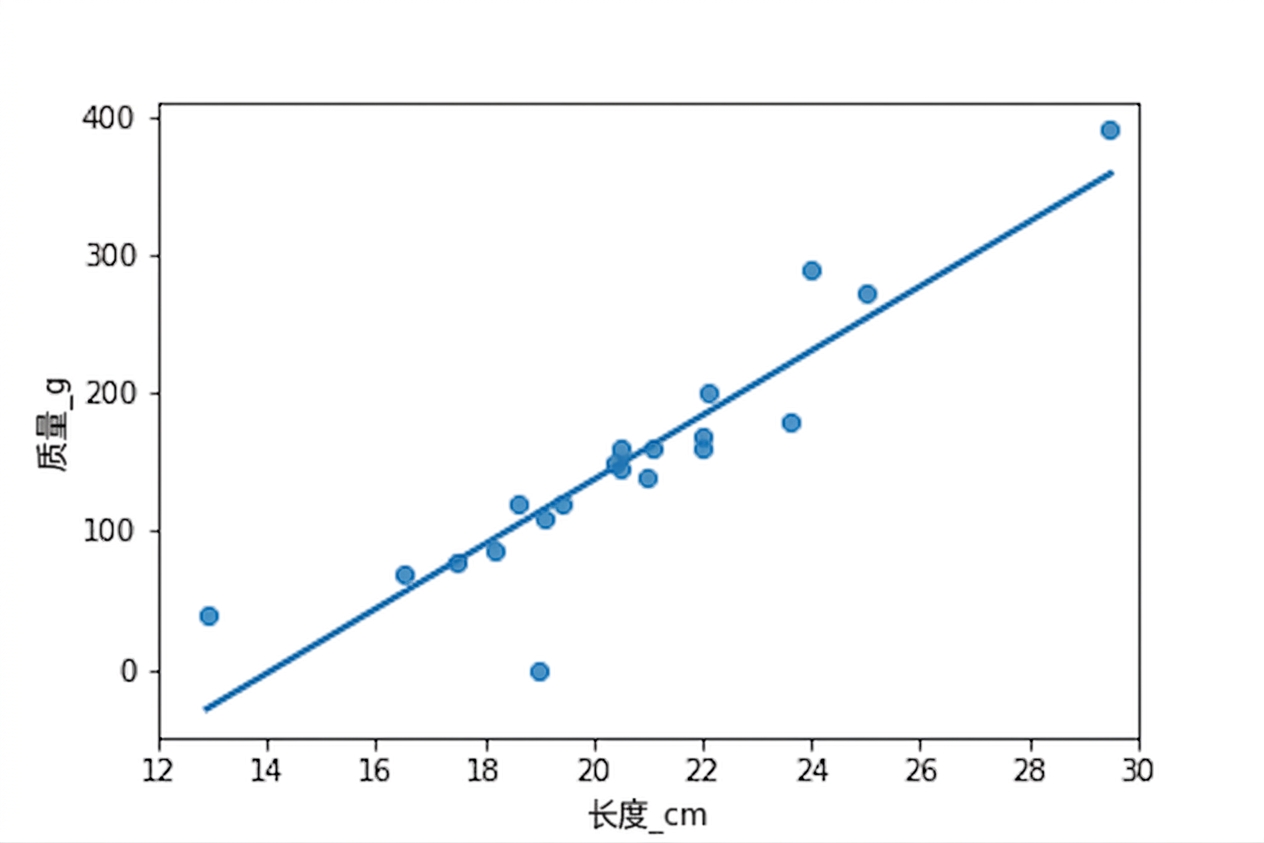
一张散点图:蟑螂体重对长度,并带趋势线。大多数点紧跟趋势线。

使用 Python 中的 statsmodels 进行回归入门

极端自变量取值

roach["extreme_l"] = ((roach["length_cm"] < 15) |
                    (roach["length_cm"] > 26))

fig = plt.figure()
sns.regplot(x="length_cm",
            y="mass_g",
            data=roach,
            ci=None)

sns.scatterplot(x="length_cm",
                y="mass_g",
                hue="extreme_l",
                data=roach)

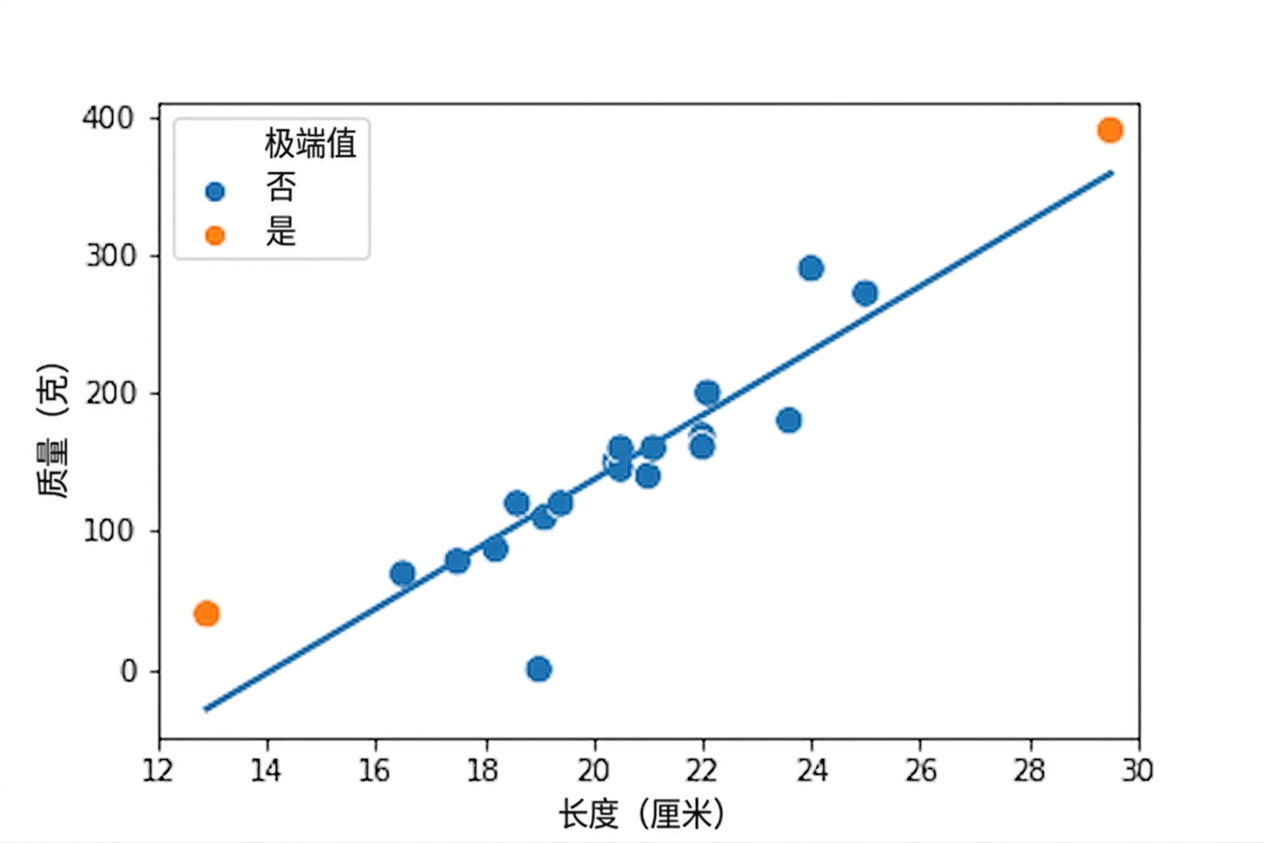
一张散点图:蟑螂体重对长度,含趋势线。大多数点为蓝色,但一只很短和一只很长的蟑螂为橙色。

使用 Python 中的 statsmodels 进行回归入门

远离回归线的响应值

roach["extreme_m"] = roach["mass_g"] < 1

fig = plt.figure()
sns.regplot(x="length_cm",
            y="mass_g",
            data=roach,
            ci=None)

sns.scatterplot(x="length_cm",
                y="mass_g",
                hue="extreme_l",
                style="extreme_m",
                data=roach)

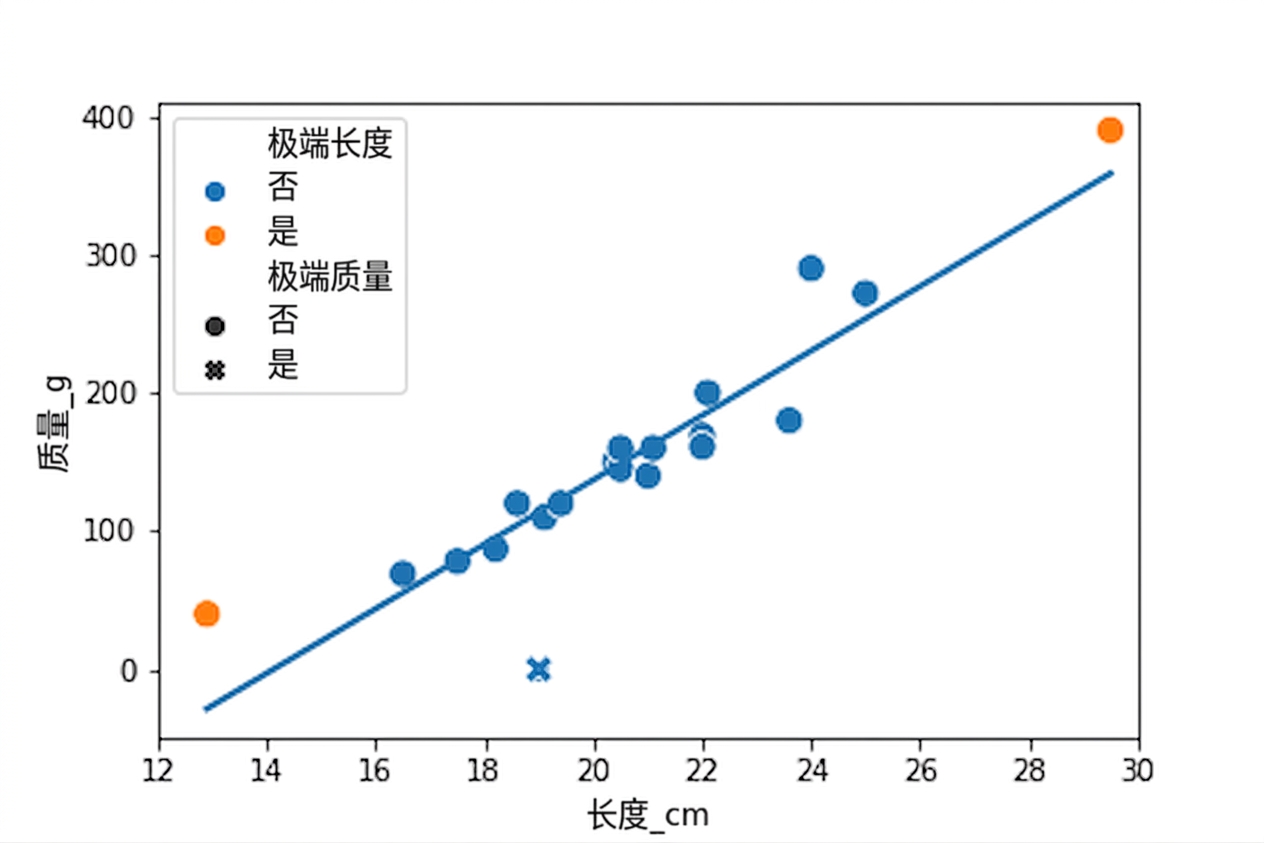
一张散点图:蟑螂体重对长度,含趋势线。大多数点为蓝色,但一只很短和一只很长的蟑螂为橙色。大多为圆点,但一只表观质量为零的鱼为叉号。

使用 Python 中的 statsmodels 进行回归入门

杠杆值与影响力

"杠杆值"衡量自变量取值有多极端。

"影响力"衡量若将该观测从建模数据中移除,模型会改变多少。

一个人在拧扳手

使用 Python 中的 statsmodels 进行回归入门

.get_influence() 与 .summary_frame()

mdl_roach = ols("mass_g ~ length_cm", data=roach).fit()

summary_roach = mdl_roach.get_influence().summary_frame()
roach["leverage"] = summary_roach["hat_diag"] print(roach.head())
   species  mass_g  length_cm  leverage
35   Roach    40.0       12.9  0.313729
36   Roach    69.0       16.5  0.125538
37   Roach    78.0       17.5  0.093487
38   Roach    87.0       18.2  0.076283
39   Roach   120.0       18.6  0.068387
使用 Python 中的 statsmodels 进行回归入门

Cook 距离

"Cook 距离"是最常用的影响力度量。

roach["cooks_dist"] = summary_roach["cooks_d"]
print(roach.head())
   species  mass_g  length_cm  leverage  cooks_dist
35   Roach    40.0       12.9  0.313729    1.074015
36   Roach    69.0       16.5  0.125538    0.010429
37   Roach    78.0       17.5  0.093487    0.000020
38   Roach    87.0       18.2  0.076283    0.001980
39   Roach   120.0       18.6  0.068387    0.006610
使用 Python 中的 statsmodels 进行回归入门

影响力最大的样本(蟑螂)

print(roach.sort_values("cooks_dist", ascending = False))
   species  mass_g  length_cm  leverage  cooks_dist
35   Roach    40.0       12.9  0.313729    1.074015 # 非常短的蟑螂
54   Roach   390.0       29.5  0.394740    0.365782 # 非常长的蟑螂
40   Roach     0.0       19.0  0.061897    0.311852 # 质量为零的蟑螂
52   Roach   290.0       24.0  0.099488    0.150064
51   Roach   180.0       23.6  0.088391    0.061209
..     ...     ...        ...       ...         ...
43   Roach   150.0       20.4  0.050264    0.000257
44   Roach   145.0       20.5  0.050092    0.000256
42   Roach   120.0       19.4  0.056815    0.000199
47   Roach   160.0       21.1  0.050910    0.000137
37   Roach    78.0       17.5  0.093487    0.000020
使用 Python 中的 statsmodels 进行回归入门

移除影响力最大的样本

roach_not_short = roach[roach["length_cm"] != 12.9]

sns.regplot(x="length_cm",
            y="mass_g",
            data=roach,
            ci=None,
            line_kws={"color": "green"})

sns.regplot(x="length_cm",
            y="mass_g",
            data=roach_not_short,
            ci=None,
            line_kws={"color": "red"})

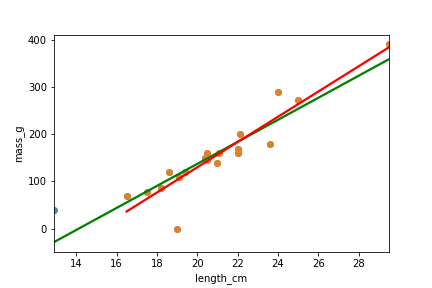
一张散点图:蟑螂体重对长度,含两条趋势线。一条用全部数据,另一条排除了最短的蟑螂。第二条斜率明显更陡。

使用 Python 中的 statsmodels 进行回归入门

Passons à la pratique !

使用 Python 中的 statsmodels 进行回归入门

Preparing Video For Download...