使用 Python 中的 statsmodels 进行回归入门
Maarten Van den Broeck
Content Developer at DataCamp
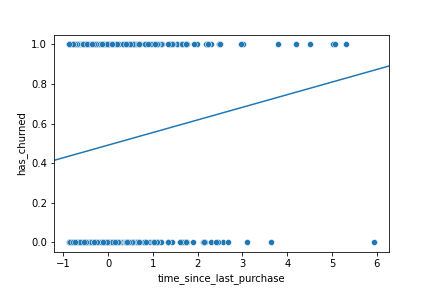
mdl_churn_vs_recency_lm = ols("has_churned ~ time_since_last_purchase",
                              data=churn).fit()

print(mdl_churn_vs_recency_lm.params)
Intercept                   0.490780
time_since_last_purchase    0.063783
dtype: float64
intercept, slope = mdl_churn_vs_recency_lm.params
sns.scatterplot(x="time_since_last_purchase",
                y="has_churned",
                data=churn)


plt.axline(xy1=(0, intercept),
           slope=slope)

plt.show()
sns.scatterplot(x="time_since_last_purchase", y="has_churned", data=churn)
plt.axline(xy1=(0, intercept), slope=slope) plt.show()
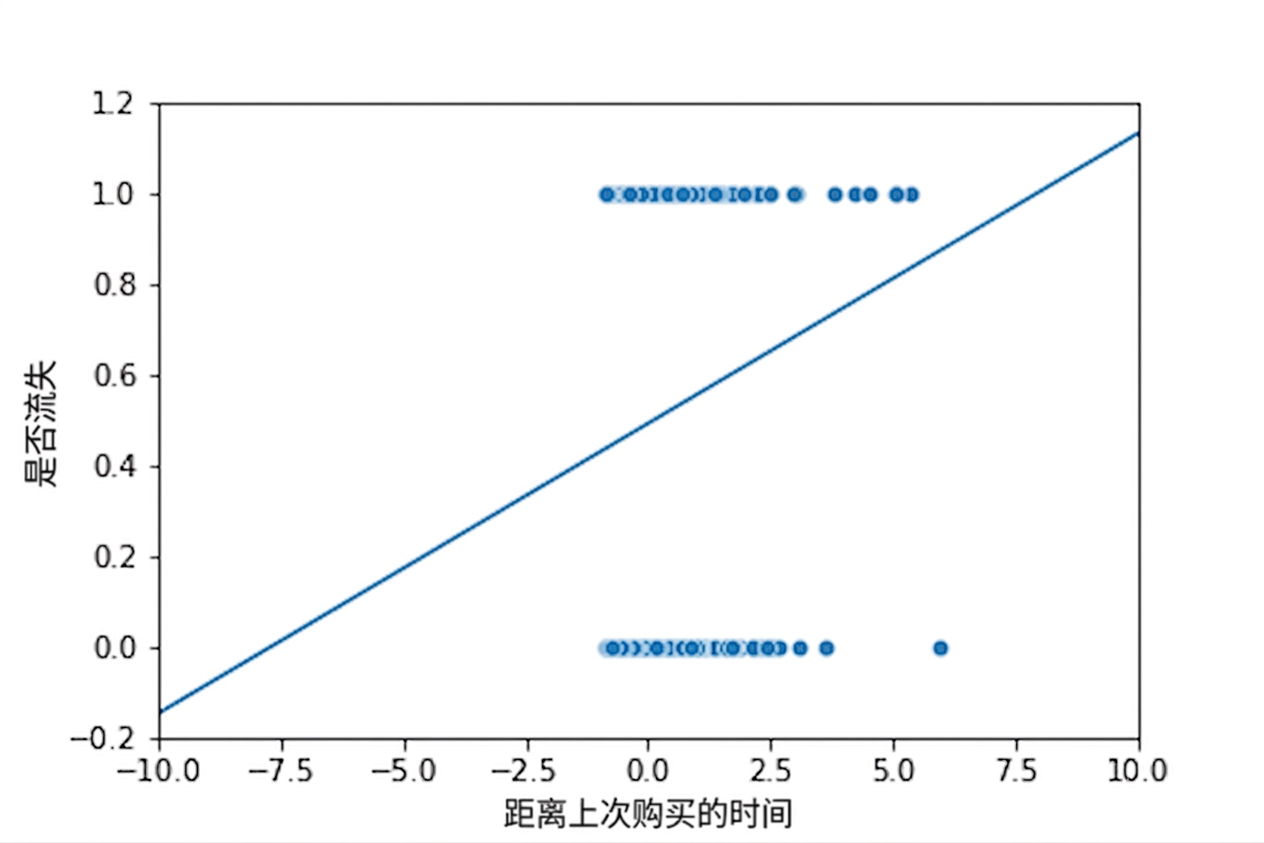
sns.scatterplot(x="time_since_last_purchase",
                y="has_churned",
                data=churn)

plt.axline(xy1=(0,intercept),
           slope=slope)


plt.xlim(-10, 10)
plt.ylim(-0.2, 1.2)

plt.show()
sns.scatterplot(x="time_since_last_purchase", y="has_churned", data=churn) plt.axline(xy1=(0,intercept), slope=slope)
plt.xlim(-10, 10) plt.ylim(-0.2, 1.2)
plt.show()
from statsmodels.formula.api import logit
mdl_churn_vs_recency_logit = logit("has_churned ~ time_since_last_purchase",
                                   data=churn).fit()

print(mdl_churn_vs_recency_logit.params)
from statsmodels.formula.api import logit mdl_churn_vs_recency_logit = logit("has_churned ~ time_since_last_purchase", data=churn).fit()
print(mdl_churn_vs_recency_logit.params)
Intercept                  -0.035019
time_since_last_purchase    0.269215
dtype: float64
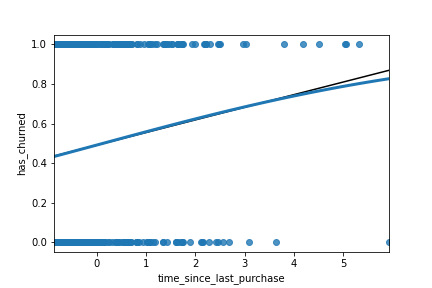
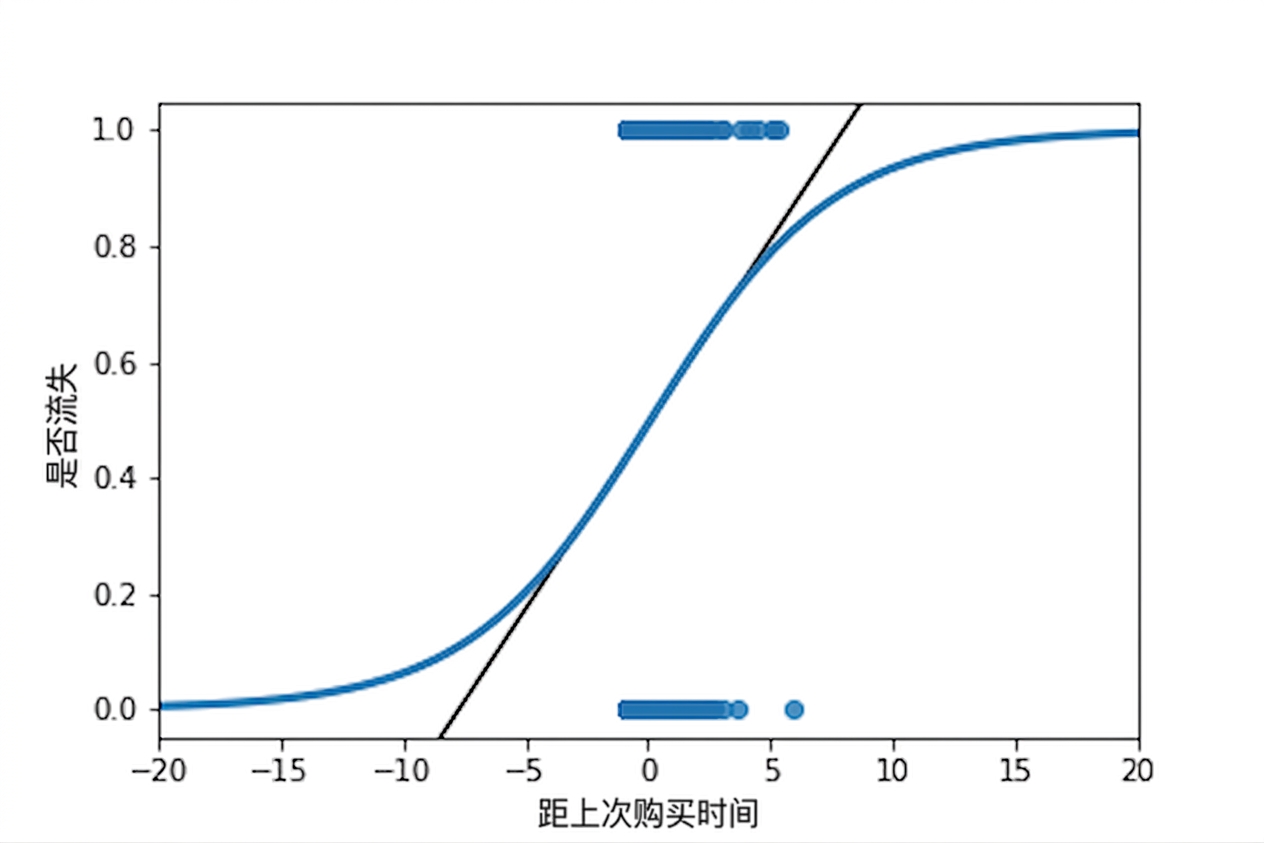
sns.regplot(x="time_since_last_purchase",
            y="has_churned",
            data=churn,
            ci=None,
            logistic=True)
plt.axline(xy1=(0,intercept),
           slope=slope,
           color="black")

plt.show()