比较抽样与自助分布
Python 抽样

James Chapman
Curriculum Manager, DataCamp
聚焦咖啡的子集
coffee_sample = coffee_ratings[["variety", "country_of_origin", "flavor"]]\
    .reset_index().sample(n=500)
     index         variety       country_of_origin  flavor
132    132           Other              Costa Rica    7.58
51      51            None  United States (Hawaii)    8.17
42      42  Yellow Bourbon                  Brazil    7.92
569    569         Bourbon               Guatemala    7.67
..     ...             ...                     ...     ...
643    643          Catuai              Costa Rica    7.42
356    356         Caturra                Colombia    7.58
494    494            None               Indonesia    7.58
169    169            None                  Brazil    7.81

[500 rows x 4 columns]
咖啡风味均值的自助法
import numpy as np
mean_flavors_5000 = []
for i in range(5000):
    mean_flavors_5000.append(
        np.mean(coffee_sample.sample(frac=1, replace=True)['flavor'])
    )
bootstrap_distn = mean_flavors_5000
风味均值的自助分布
import matplotlib.pyplot as plt
plt.hist(bootstrap_distn, bins=15)
plt.show()
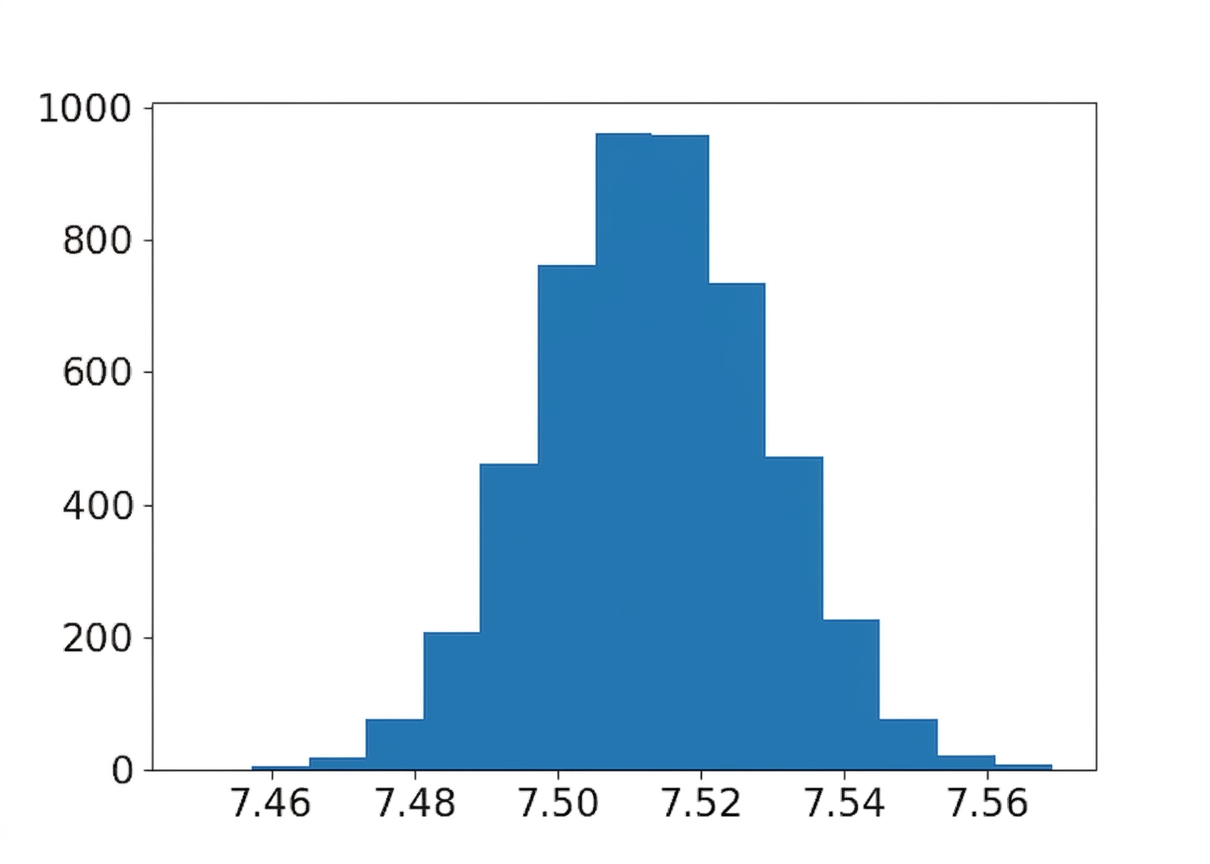
样本、自助分布、总体的均值
样本均值:
coffee_sample['flavor'].mean()
7.5132200000000005
总体均值的估计:
np.mean(bootstrap_distn)
7.513357731999999
真实总体均值:
coffee_ratings['flavor'].mean()
7.526046337817639
解读均值
自助分布的均值:
- 通常接近样本均值
- 可能不是总体均值的良好估计
自助法无法纠正抽样带来的偏差
样本sd vs. 自助分布sd
样本标准差:
coffee_sample['flavor'].std()
0.3540883911928703
总体标准差的估计?
np.std(bootstrap_distn, ddof=1)
0.015768474367958217
样本、自助、总体的标准差
样本标准差:
coffee_sample['flavor'].std()
0.3540883911928703
总体标准差的估计:
standard_error = np.std(bootstrap_distn, ddof=1)
标准误 是关注统计量的标准差
真实标准差:
coffee_ratings['flavor'].std(ddof=0)
0.34125481224622645
standard_error * np.sqrt(500)
0.3525938058821761
标准误乘以样本量的平方根可估计总体标准差
解读标准误
- 估计的标准误 → 样本统计量的自助分布的标准差
- $\text{总体标准差} \approx \text{标准误} \times \sqrt{\text{样本量}}$
Passons à la pratique !
Python 抽样

