Grafice liniare
Introducere în Tidyverse

David Robinson
Chief Data Scientist, DataCamp
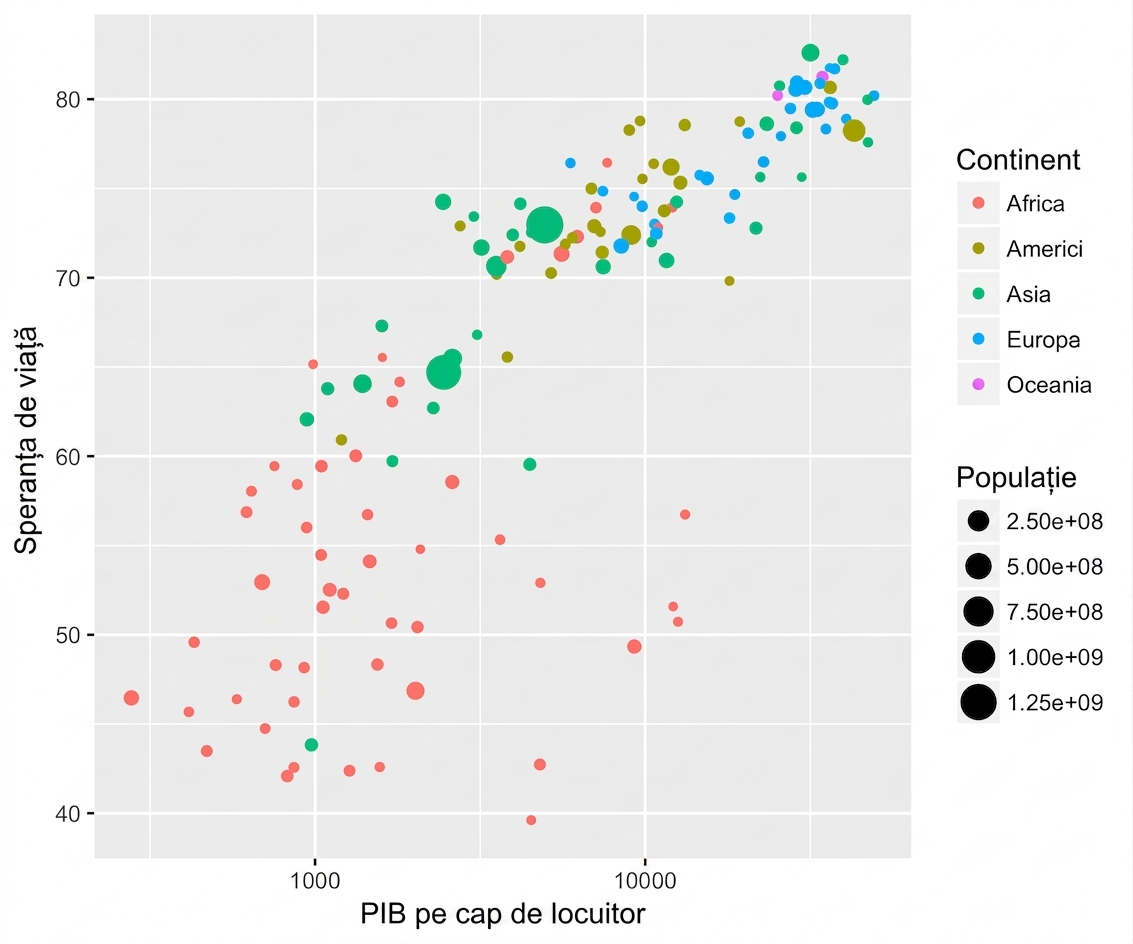
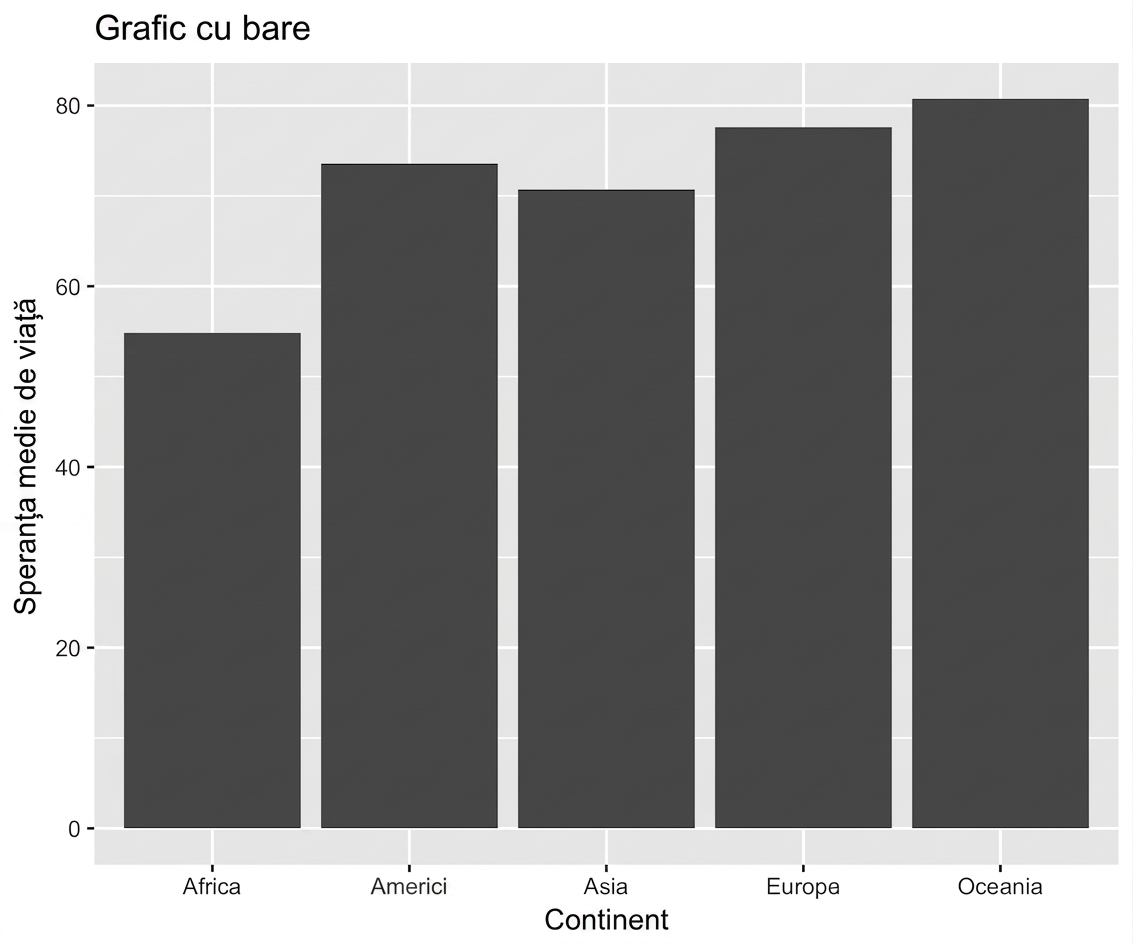
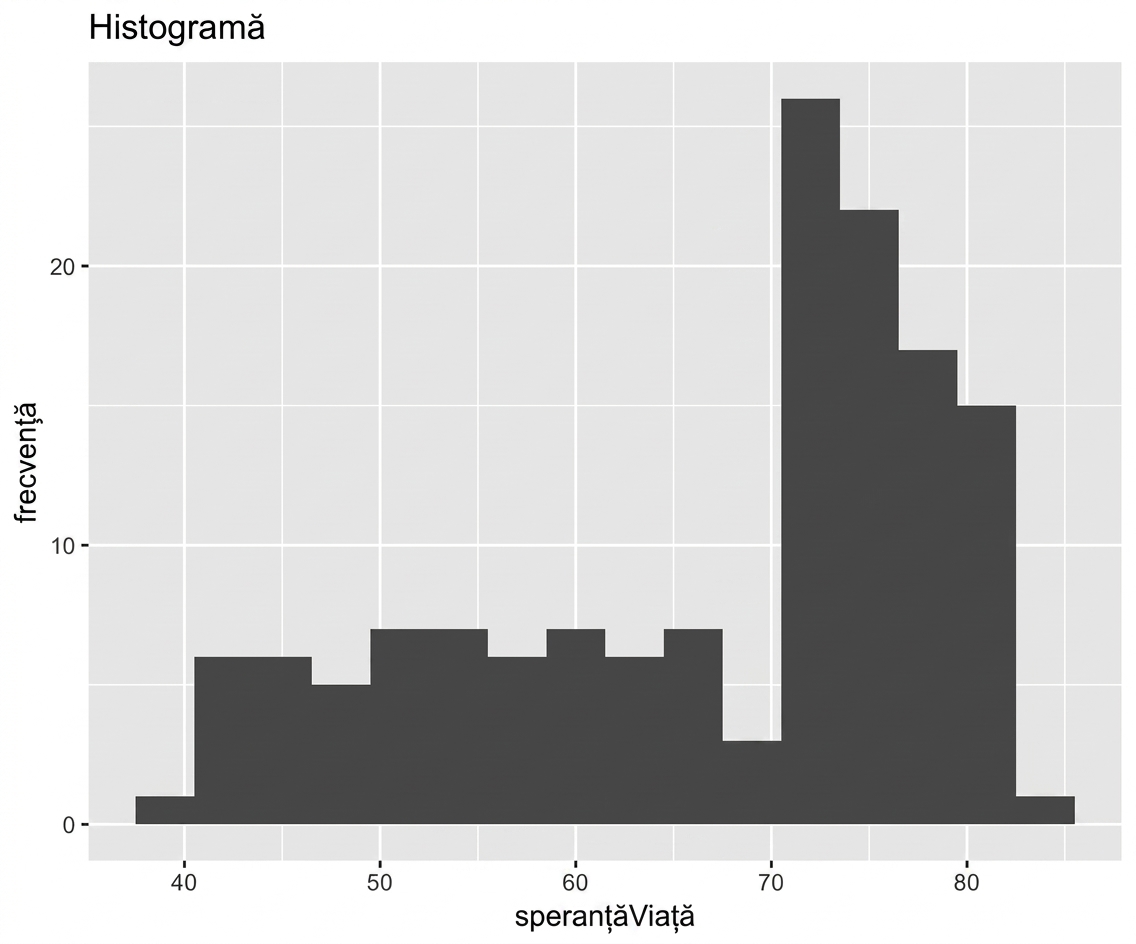
Tipuri de grafice
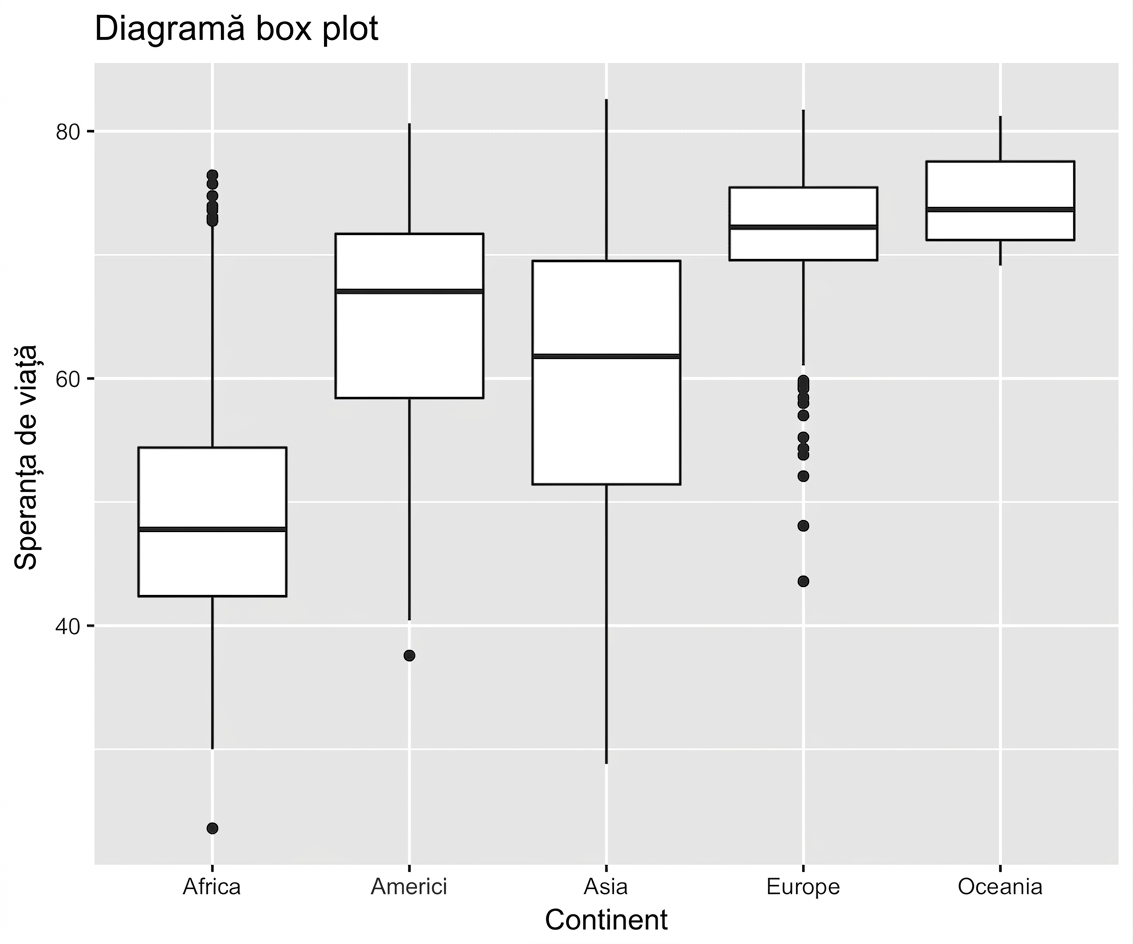
Grafic punct vs. liniar
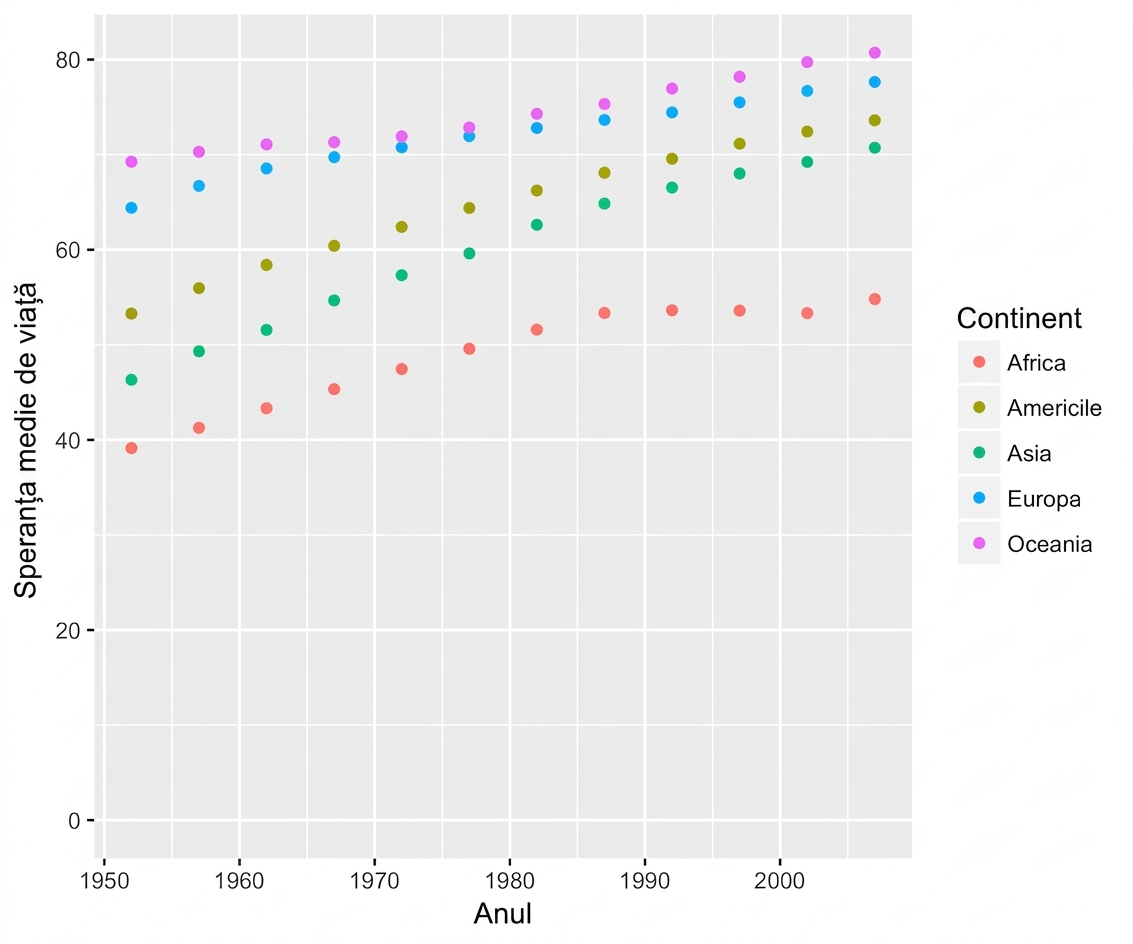
geom_point()
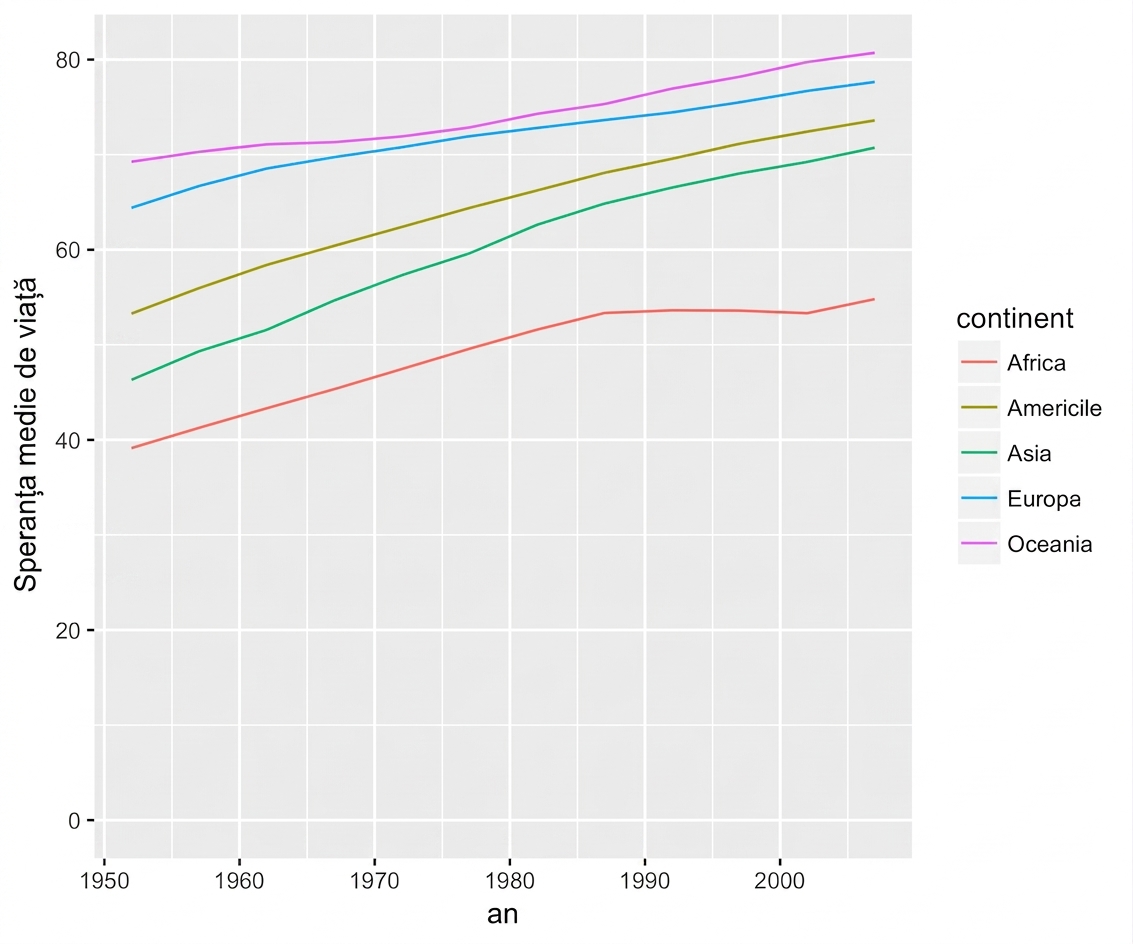
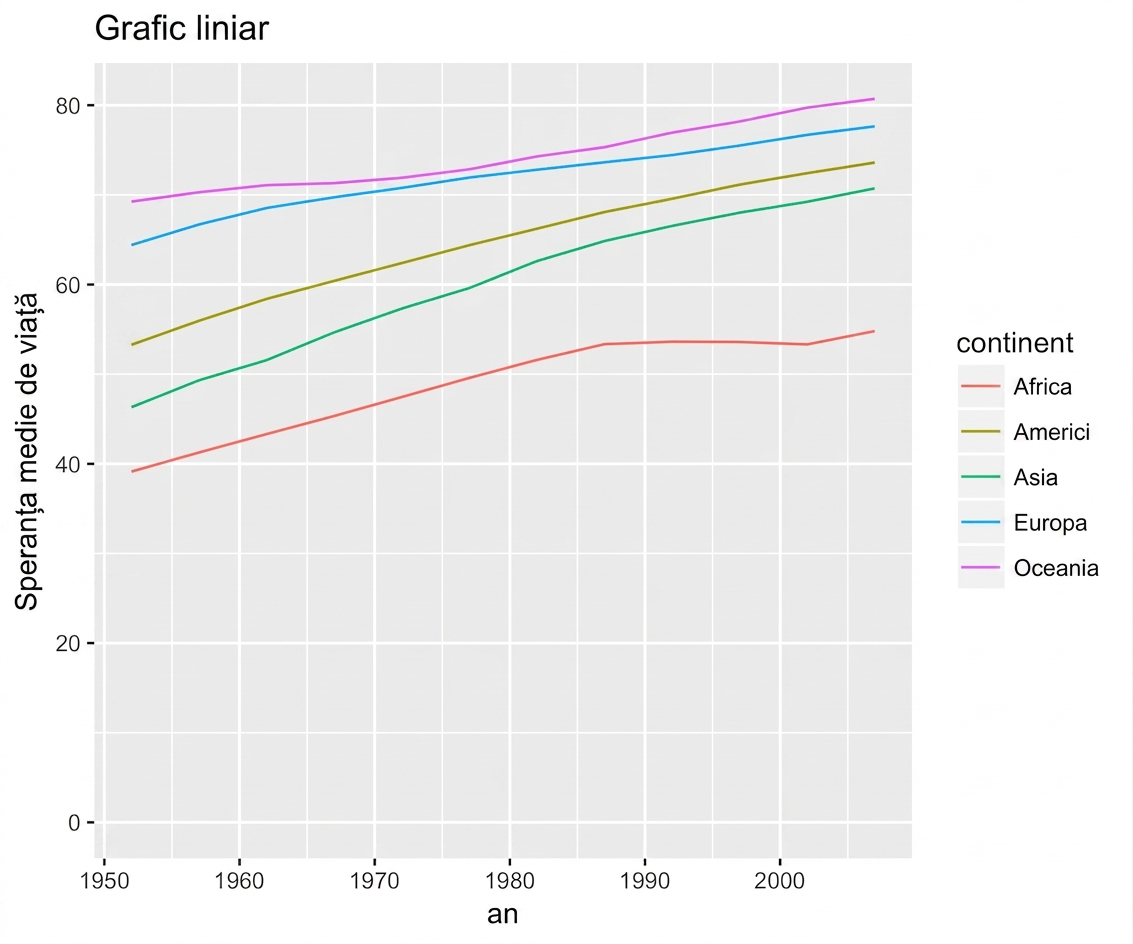
geom_line()
Grafic liniar
ggplot(year_continent, aes(x = year, y = meanLifeExp, color = continent)) +
  geom_line() +
  expand_limits(y = 0)

