Grafice linie

Introducere în vizualizarea datelor cu ggplot2

Rick Scavetta

Founder, Scavetta Academy

Tipuri comune de grafice

Tip grafic Geomuri posibile
Diagrame puncte points, jitter, abline, smooth, count
Diagrame bare histogram, bar, col, errorbar
Grafice linie line, path
Introducere în vizualizarea datelor cu ggplot2

Castor

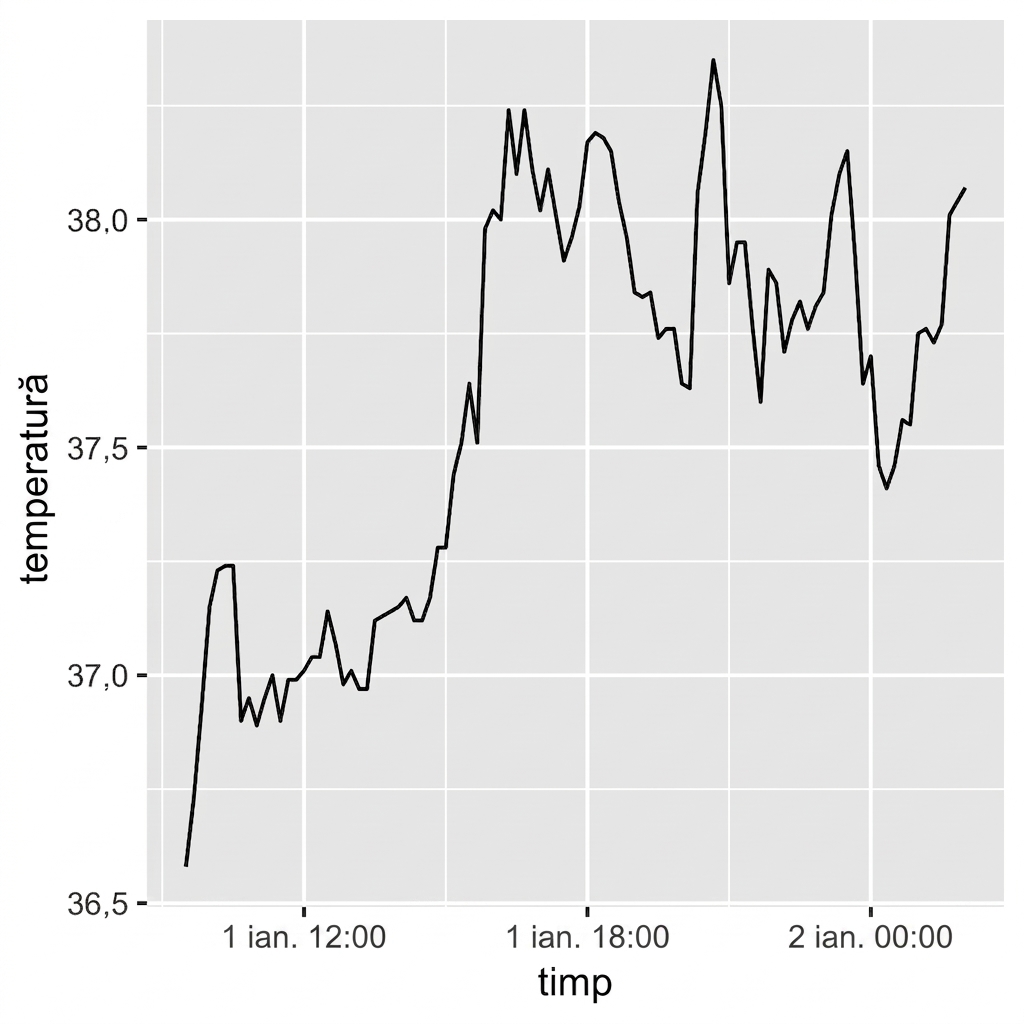
str(beaver)
'data.frame':    101 obs. of  3 variables:
 $ time  : POSIXct, format: "2000-01-01 09:30:00" "2000-01-01 09:40:00" "2000-01-01 09:50:00" ...
 $ temp  : num  36.6 36.7 36.9 37.1 37.2 ...
 $ active: Factor w/ 2 levels "0","1": 1 1 1 1 1 1 1 1 1 1 ...
Introducere în vizualizarea datelor cu ggplot2

Castor

ggplot(beaver, aes(x = time, y = temp)) +
  geom_line()

Introducere în vizualizarea datelor cu ggplot2

Castor

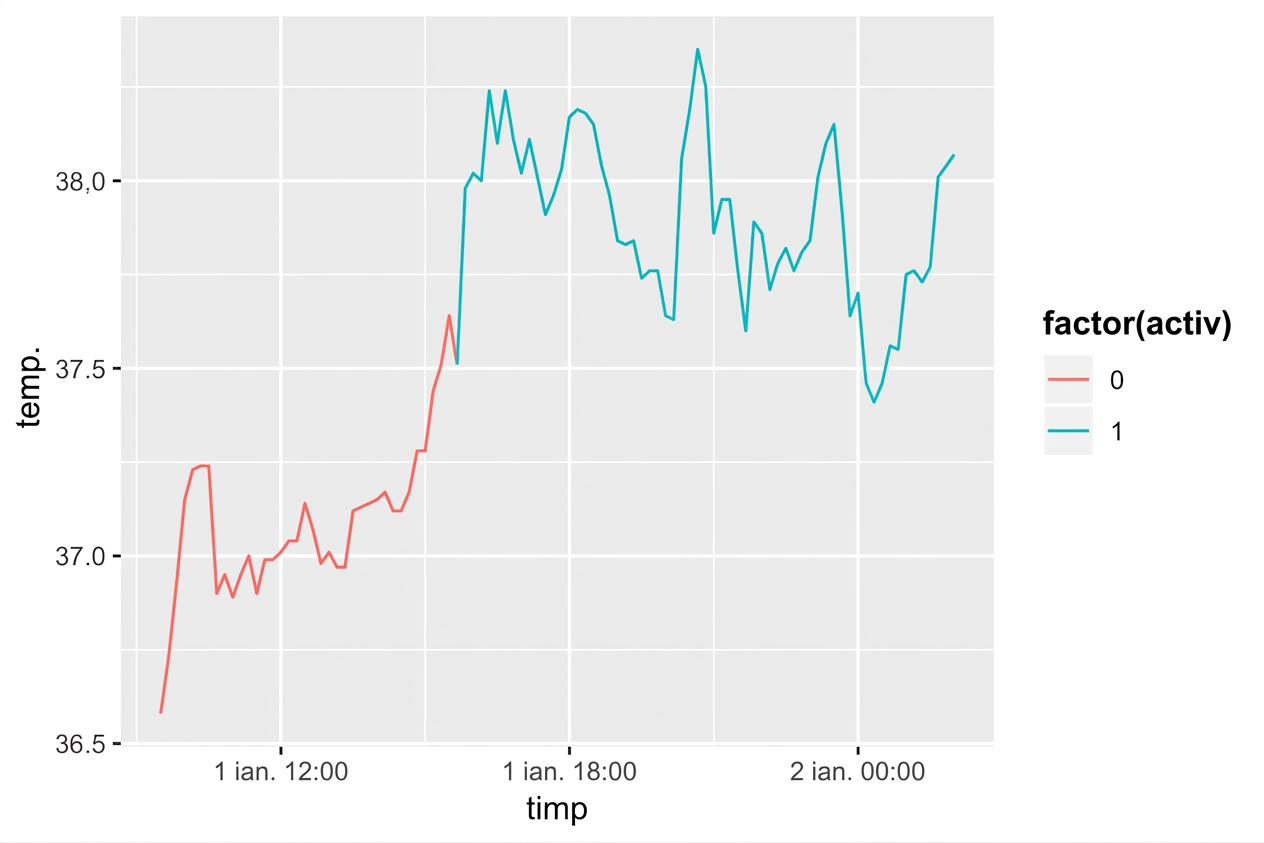
ggplot(beaver, aes(x = time, y = temp, 
                   color = factor(active))
                   ) +
  geom_line()

Introducere în vizualizarea datelor cu ggplot2

Setul de date fish

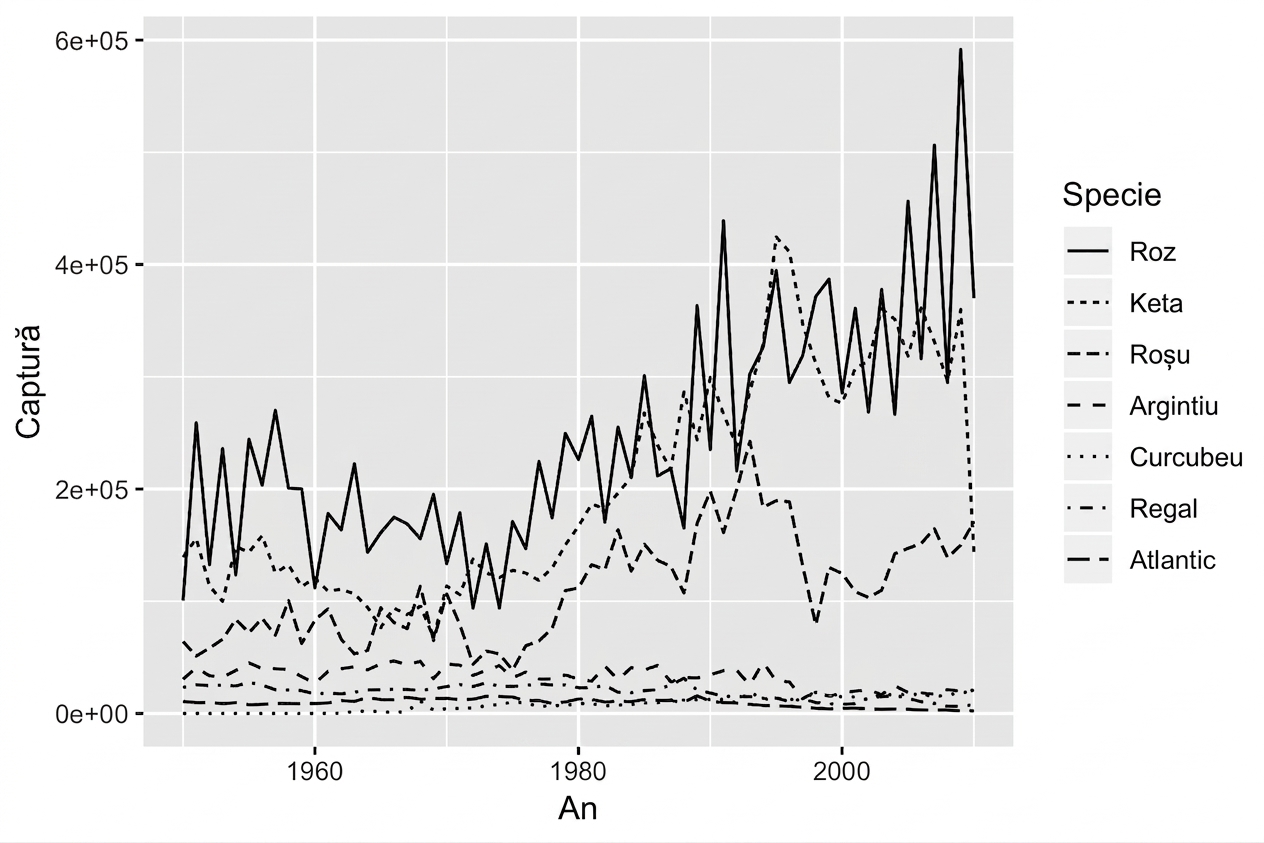
str(fish)
'data.frame':    427 obs. of  3 variables:
 $ Species: Factor w/ 7 levels "Pink","Chum",..: 1 2 3 4 5 6 7 1 2 3 ...
 $ Year   : int  1950 1950 1950 1950 1950 1950 1950 1951 1951 1951 ...
 $ Capture: int  100600 139300 64100 30500 0 23200 10800 259000 155900 51200 ...
Introducere în vizualizarea datelor cu ggplot2

Estetica linetype

ggplot(fish, aes(x = Year, 
                 y = Capture, 
                 linetype = Species)) + 
  geom_line()

Introducere în vizualizarea datelor cu ggplot2

Estetica size

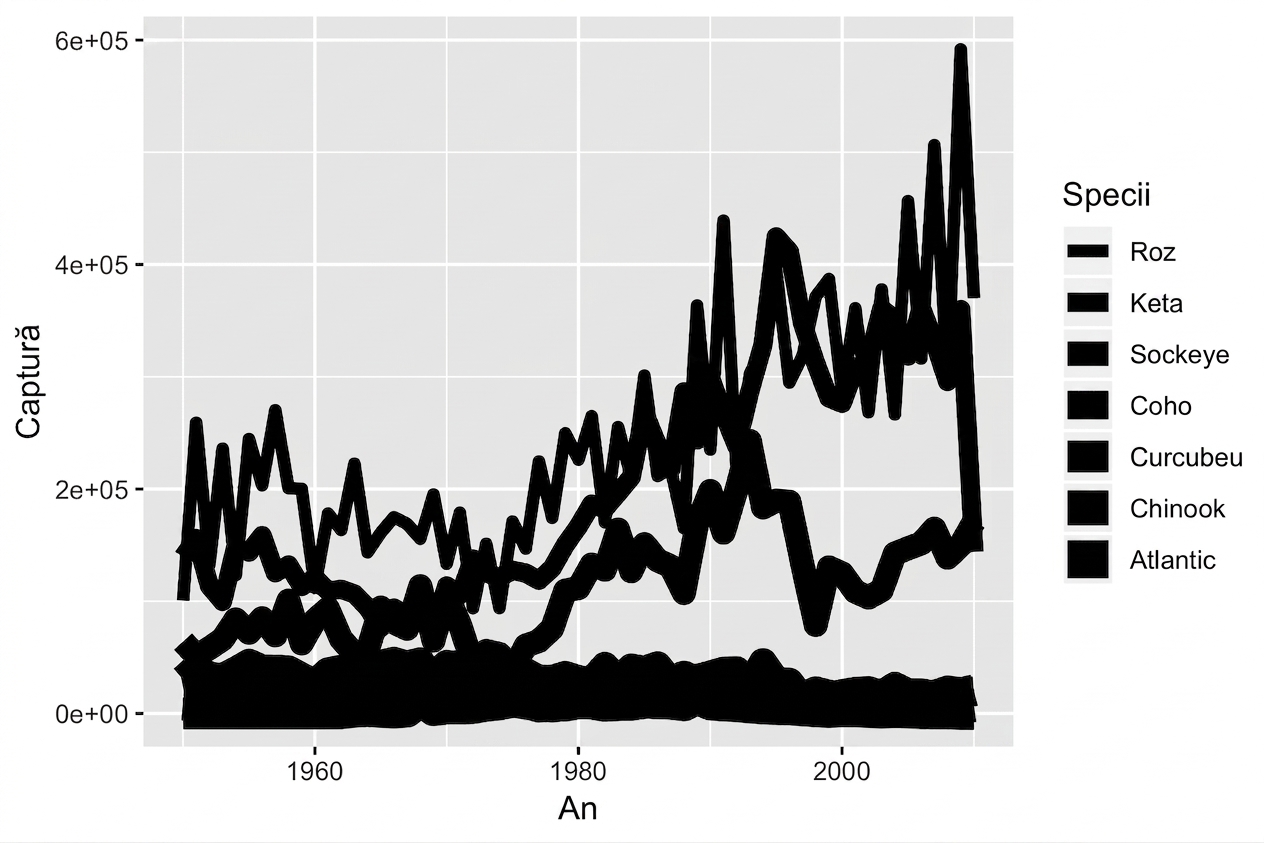
ggplot(fish, aes(x = Year, 
                 y = Capture, 
                 size = Species)) + 
  geom_line()

Introducere în vizualizarea datelor cu ggplot2

Estetica color

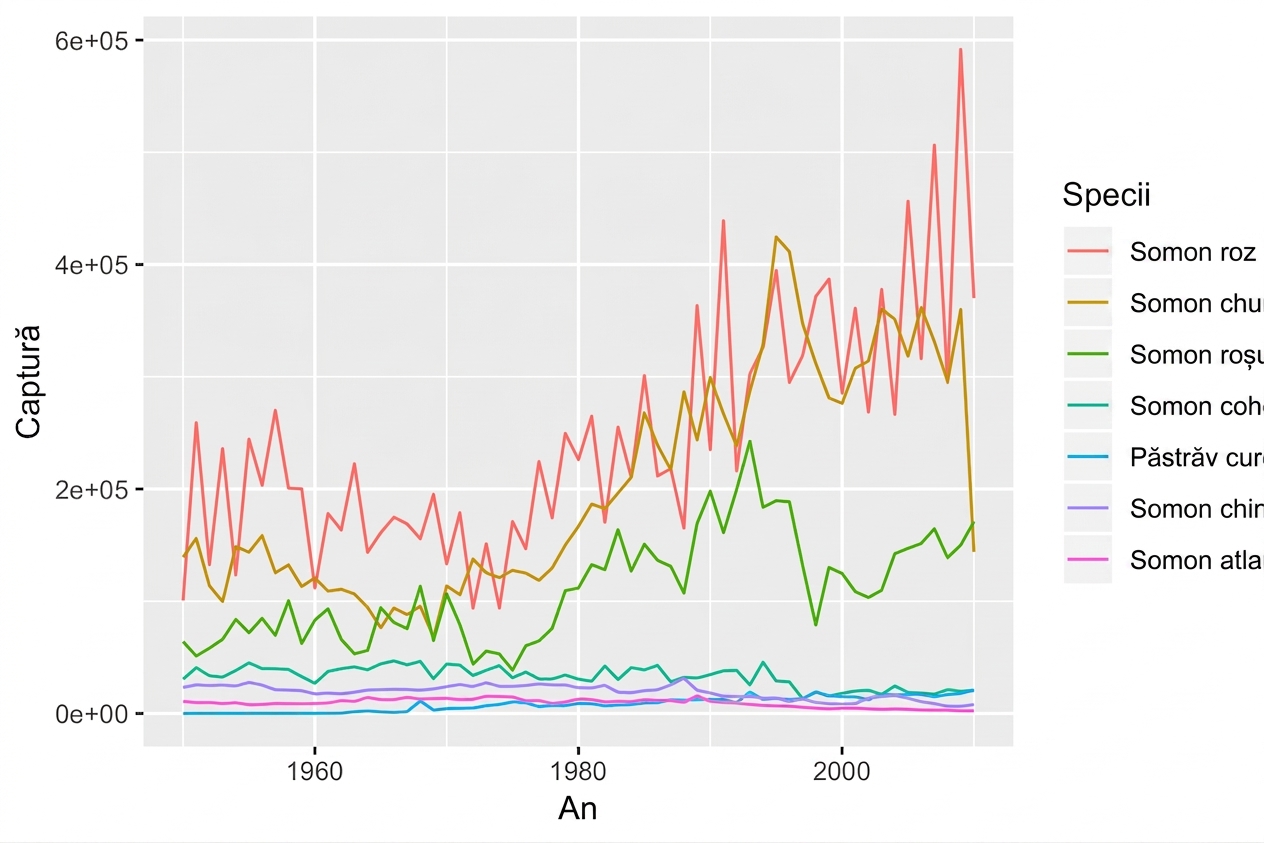
ggplot(fish, aes(x = Year, 
                 y = Capture, 
                 color = Species)) + 
  geom_line()

Introducere în vizualizarea datelor cu ggplot2

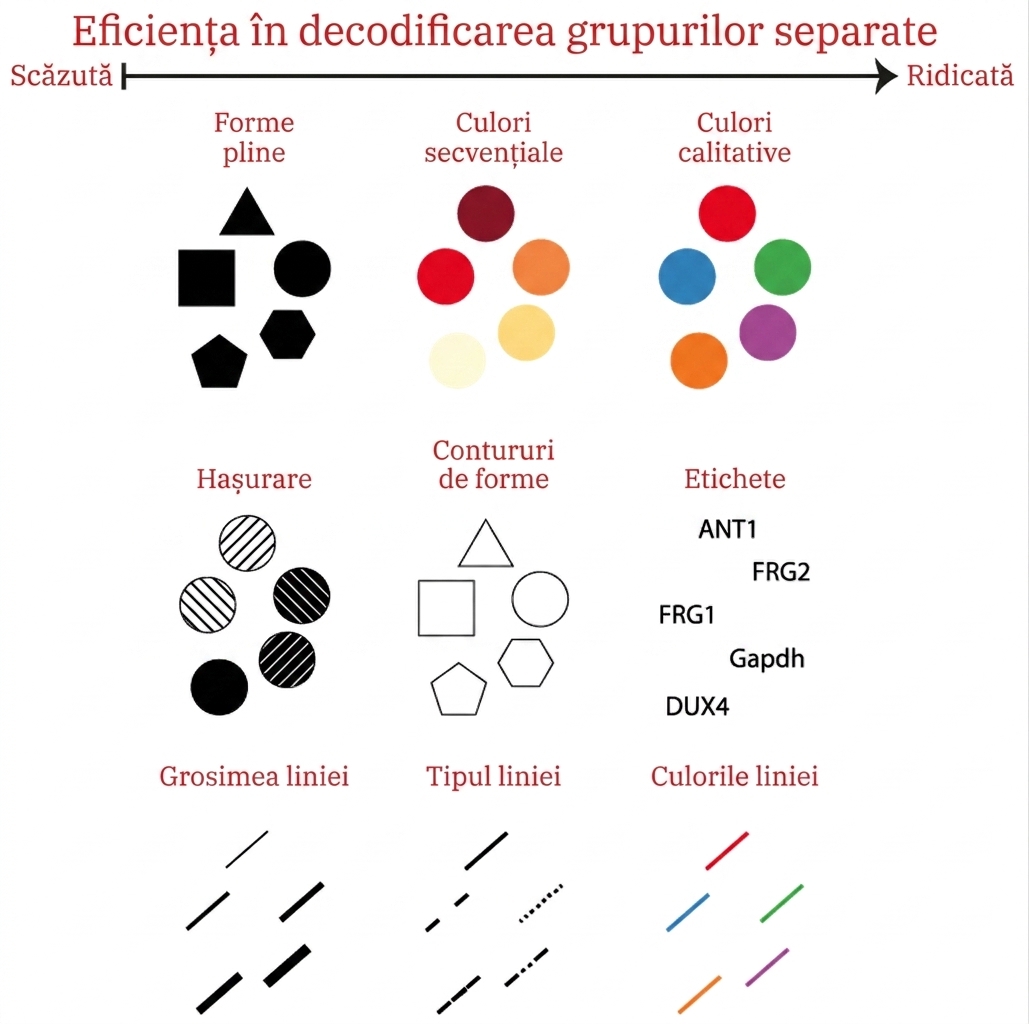
Estetici pentru variabile categoriale
Introducere în vizualizarea datelor cu ggplot2

Estetica fill cu geom_area()

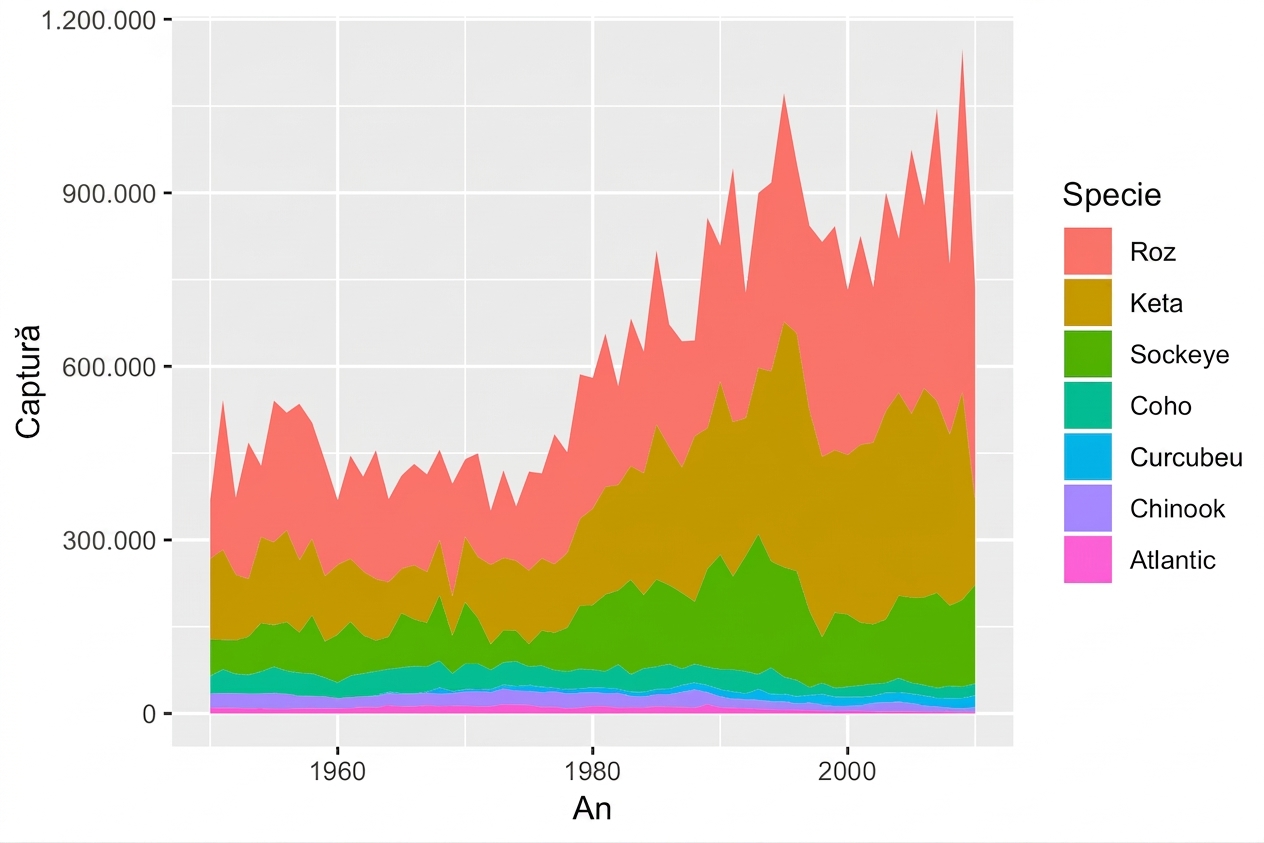
ggplot(fish, aes(x = Year, 
                 y = Capture, 
                 fill = Species)) + 
  geom_area()

Introducere în vizualizarea datelor cu ggplot2

Utilizarea position = "fill"

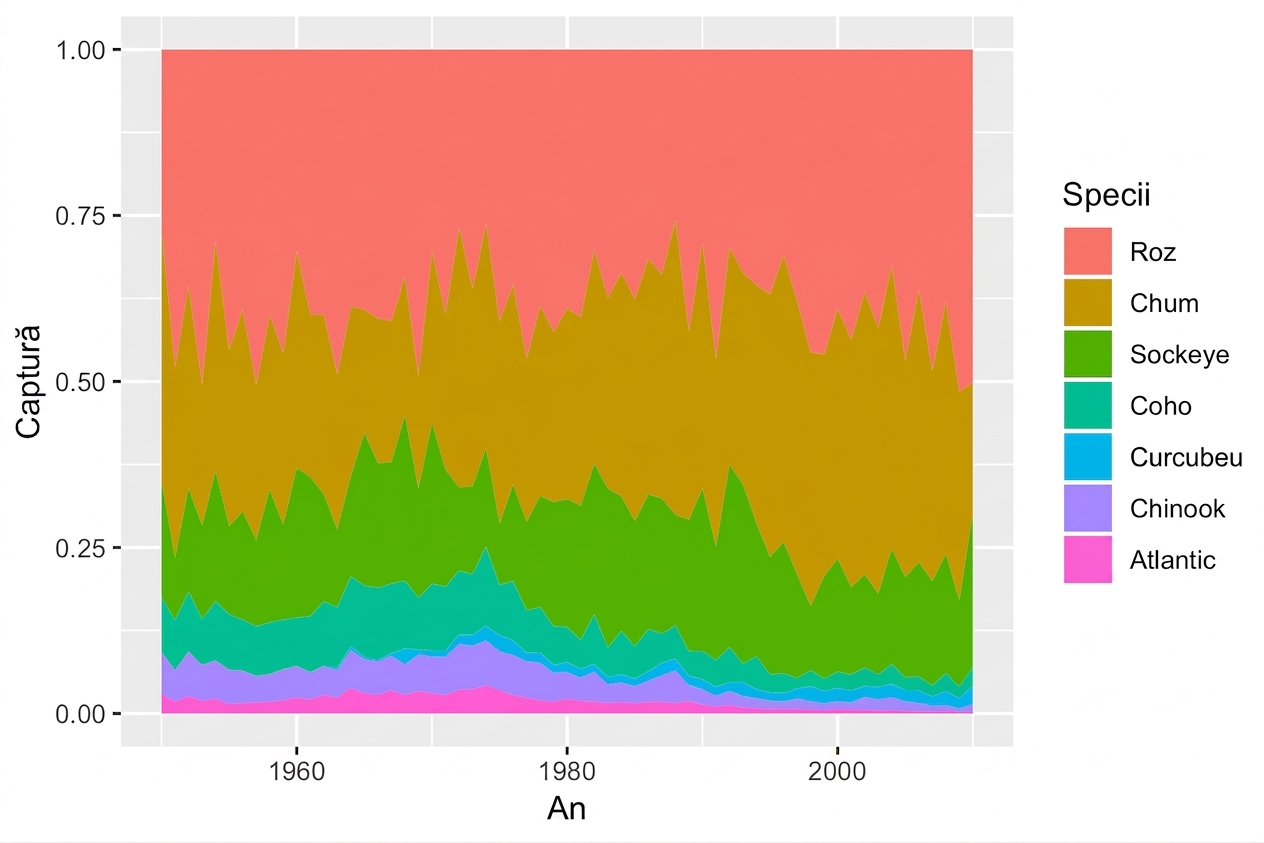
ggplot(fish, aes(x = Year, 
                 y = Capture, 
                 fill = Species)) + 
  geom_area(position = "fill")

Introducere în vizualizarea datelor cu ggplot2

geom_ribbon()

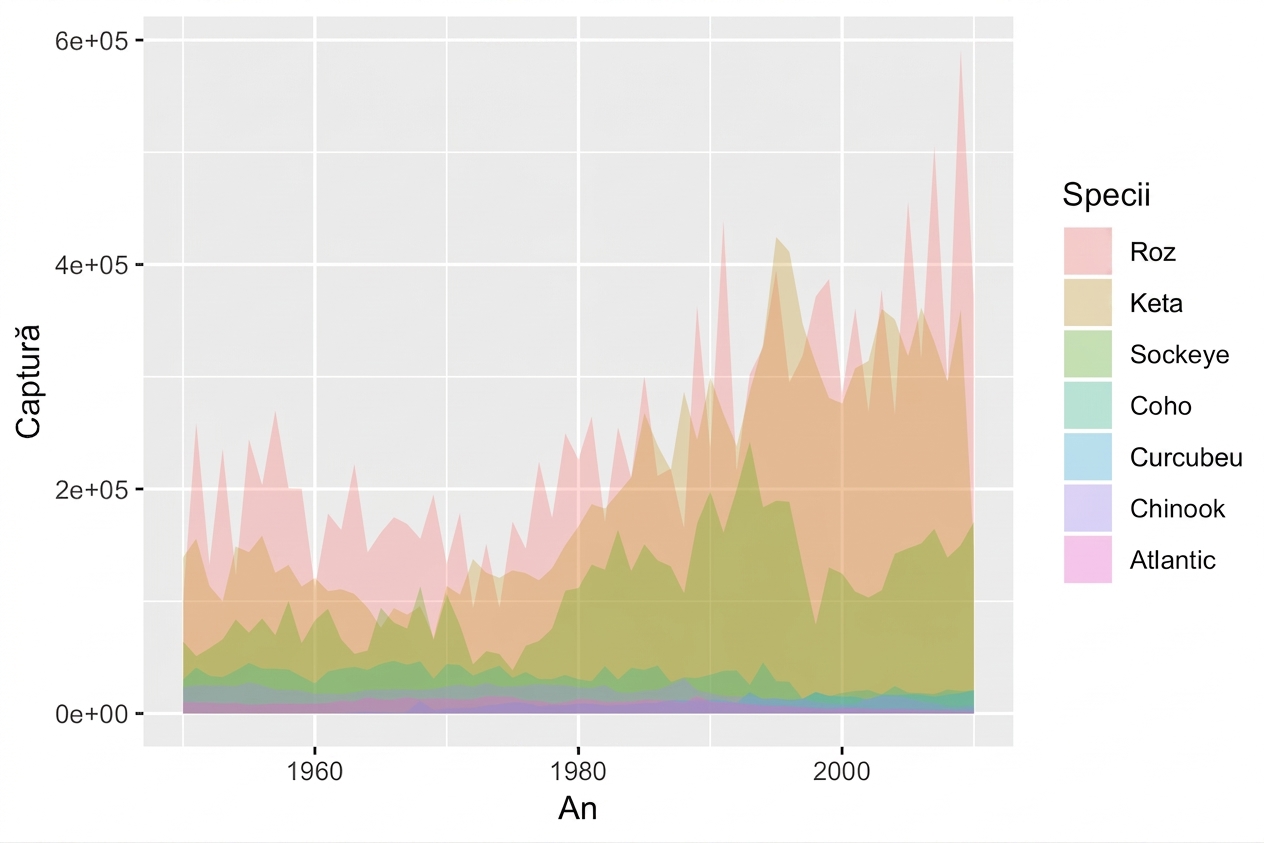
ggplot(fish, aes(x = Year, 
                 y = Capture, 
                 fill = Species)) + 
  geom_ribbon(aes(ymax = Capture, 
                  ymin = 0), 
              alpha = 0.3)

Introducere în vizualizarea datelor cu ggplot2

Să exersăm!

Introducere în vizualizarea datelor cu ggplot2

Preparing Video For Download...