Introducere în vizualizarea datelor cu ggplot2
Rick Scavetta
Founder, Scavetta Academy
Trei tipuri
| tip |
|---|
| text |
| linie |
| dreptunghi |
Trei tipuri
| tip | modificat cu |
|---|---|
| text | element_text() |
| linie | element_line() |
| dreptunghi | element_rect() |
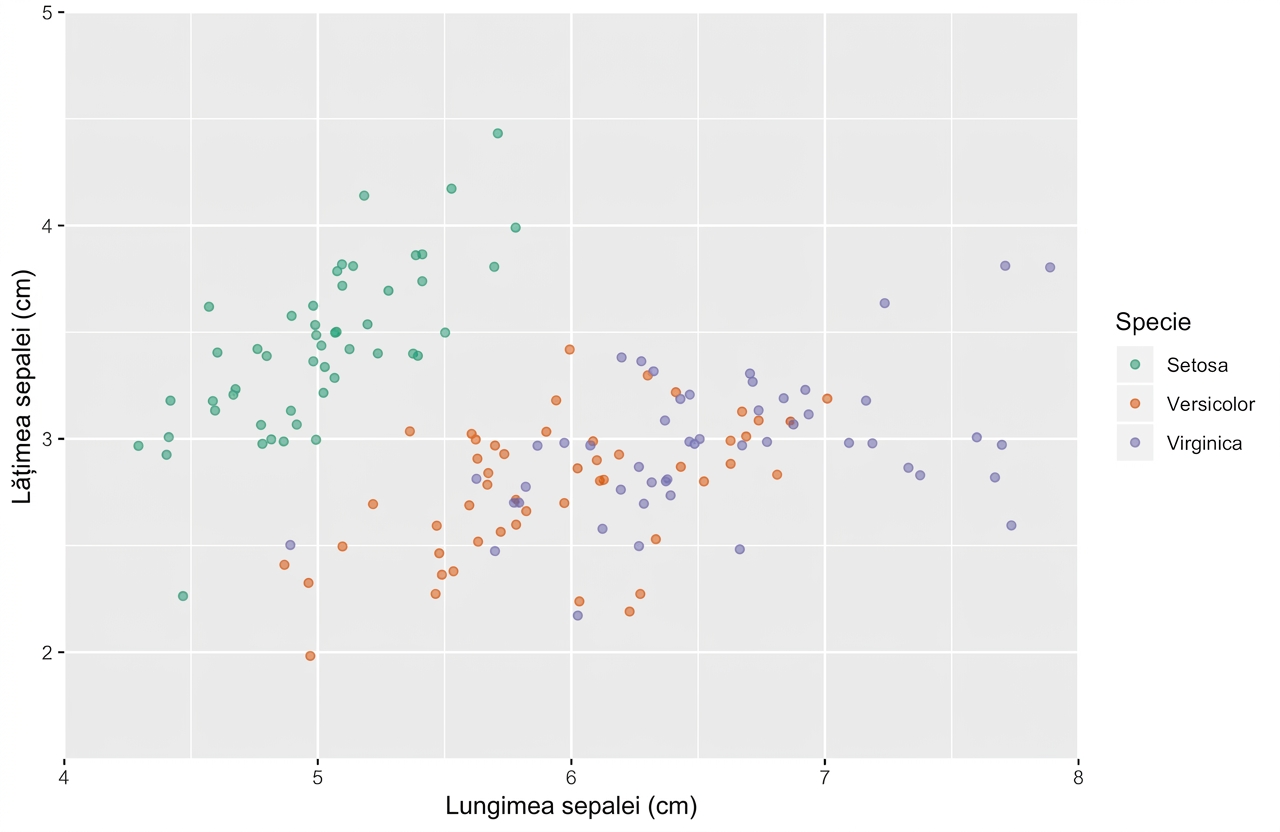
ggplot(iris, aes(x = Sepal.Length, y = Sepal.Width, color = Species)) +
geom_jitter(alpha = 0.6)

text
axis.title
axis.title.x
axis.title.x.top
axis.title.x.bottom
axis.title.y
axis.title.y.left
axis.title.y.right
title
legend.title
plot.title
plot.subtitle
plot.caption
plot.tag
axis.text
axis.text.x
axis.text.x.top
axis.text.x.bottom
axis.text.y
axis.text.y.left
axis.text.y.right
legend.text
strip.text
strip.text.x
strip.text.y

theme(
text,
axis.title,
axis.title.x,
axis.title.x.top,
axis.title.x.bottom,
axis.title.y,
axis.title.y.left,
axis.title.y.right,
title,
legend.title,
plot.title,
plot.subtitle,
plot.caption,
plot.tag,
axis.text,
axis.text.x,
axis.text.x.top,
axis.text.x.bottom,
axis.text.y,
axis.text.y.left,
axis.text.y.right,
legend.text,
strip.text,
strip.text.x,
strip.text.y)
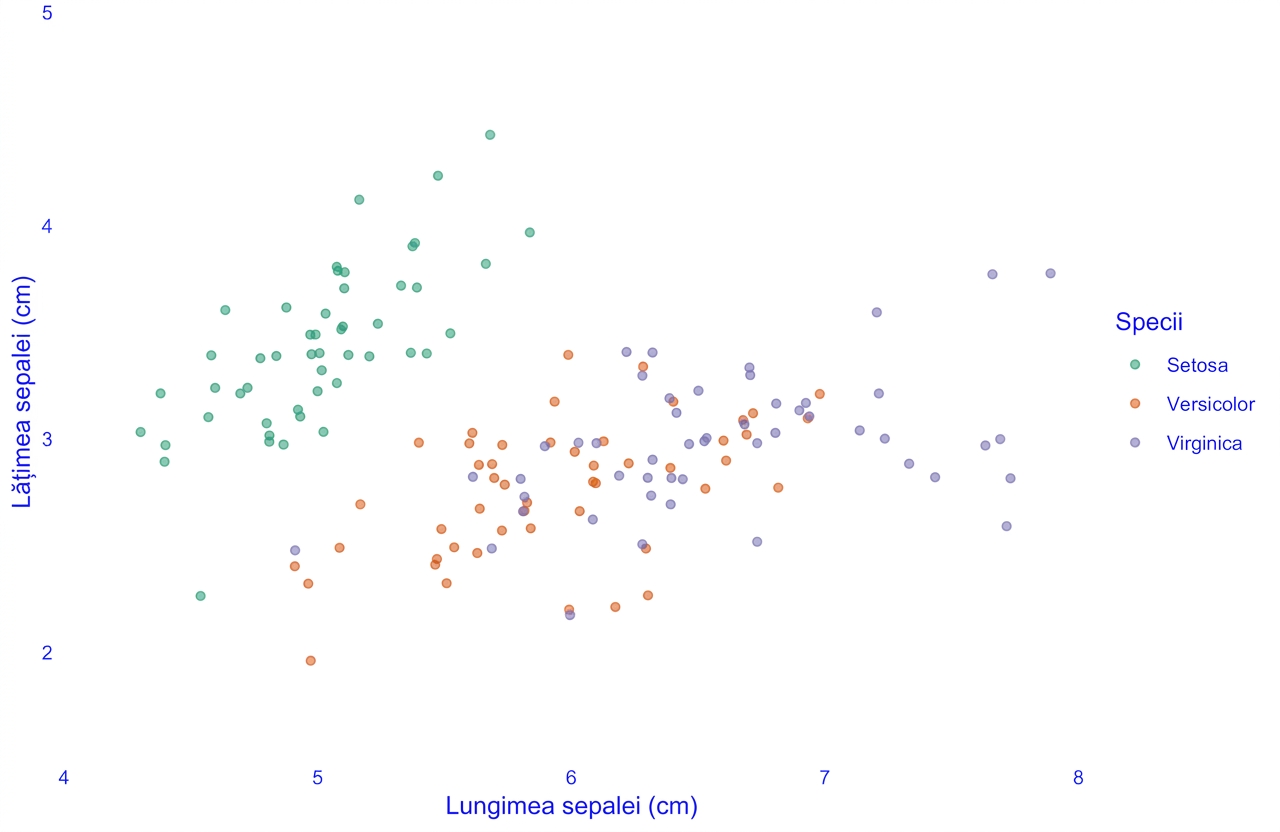
ggplot(iris, aes(x = Sepal.Length, y = Sepal.Width, color = Species)) +
geom_jitter(alpha = 0.6) +
theme(axis.title = element_text(color = "blue"))
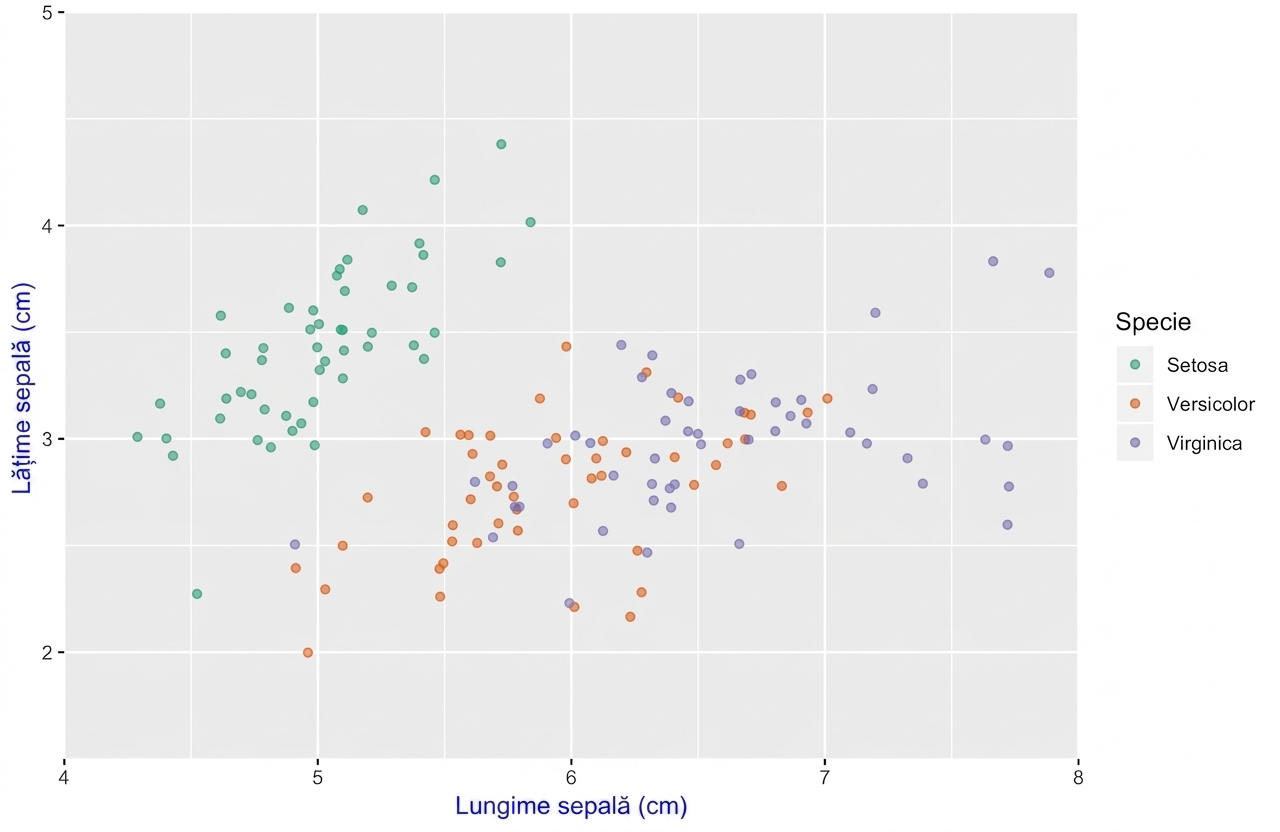
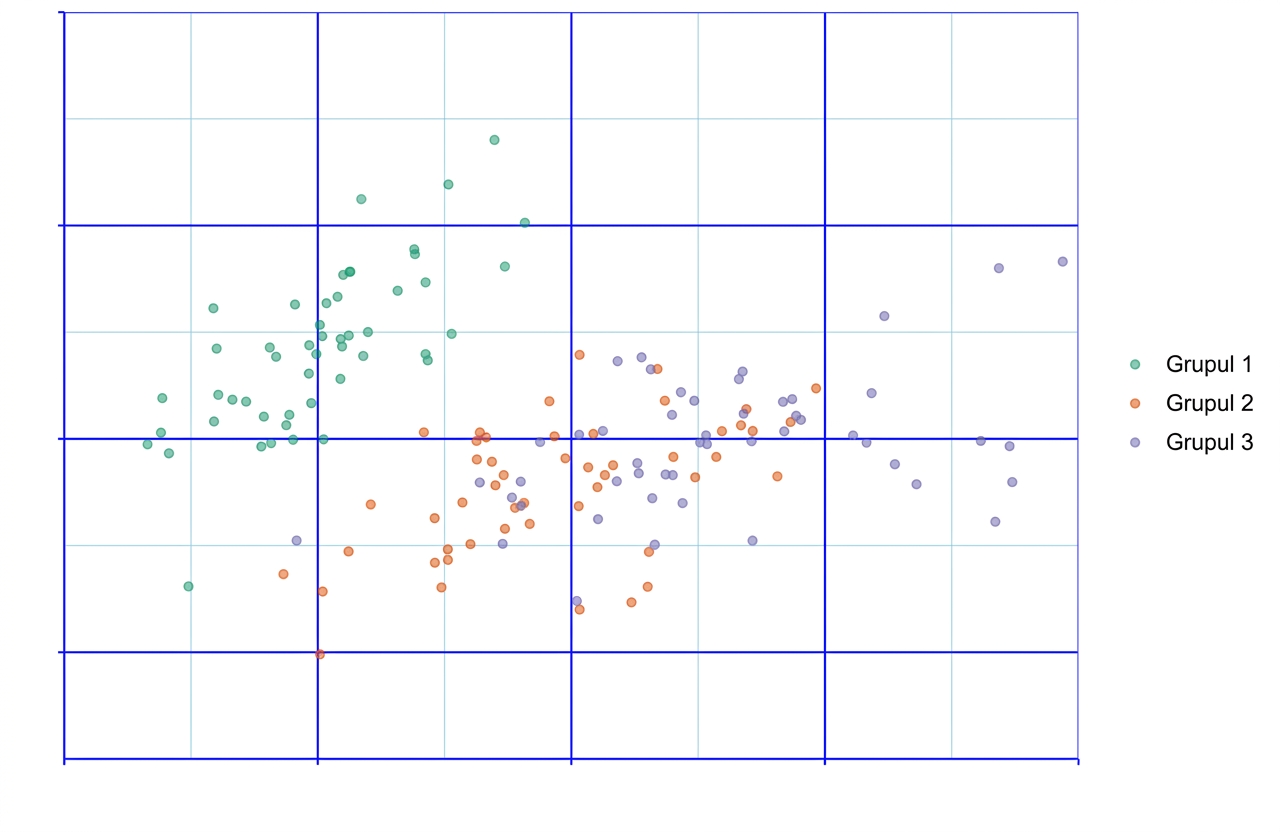
ggplot(iris, aes(x = Sepal.Length, y = Sepal.Width, color = Species)) +
geom_jitter(alpha = 0.6)


theme(
line,
axis.ticks,
axis.ticks.x,
axis.ticks.x.top,
axis.ticks.x.bottom,
axis.ticks.y,
axis.ticks.y.left,
axis.ticks.y.right,
axis.line,
axis.line.x,
axis.line.x.top,
axis.line.x.bottom,
axis.line.y,
axis.line.y.left,
axis.line.y.right,
panel.grid,
panel.grid.major,
panel.grid.major.x,
panel.grid.major.y,
panel.grid.minor,
panel.grid.minor.x,
panel.grid.minor.y)
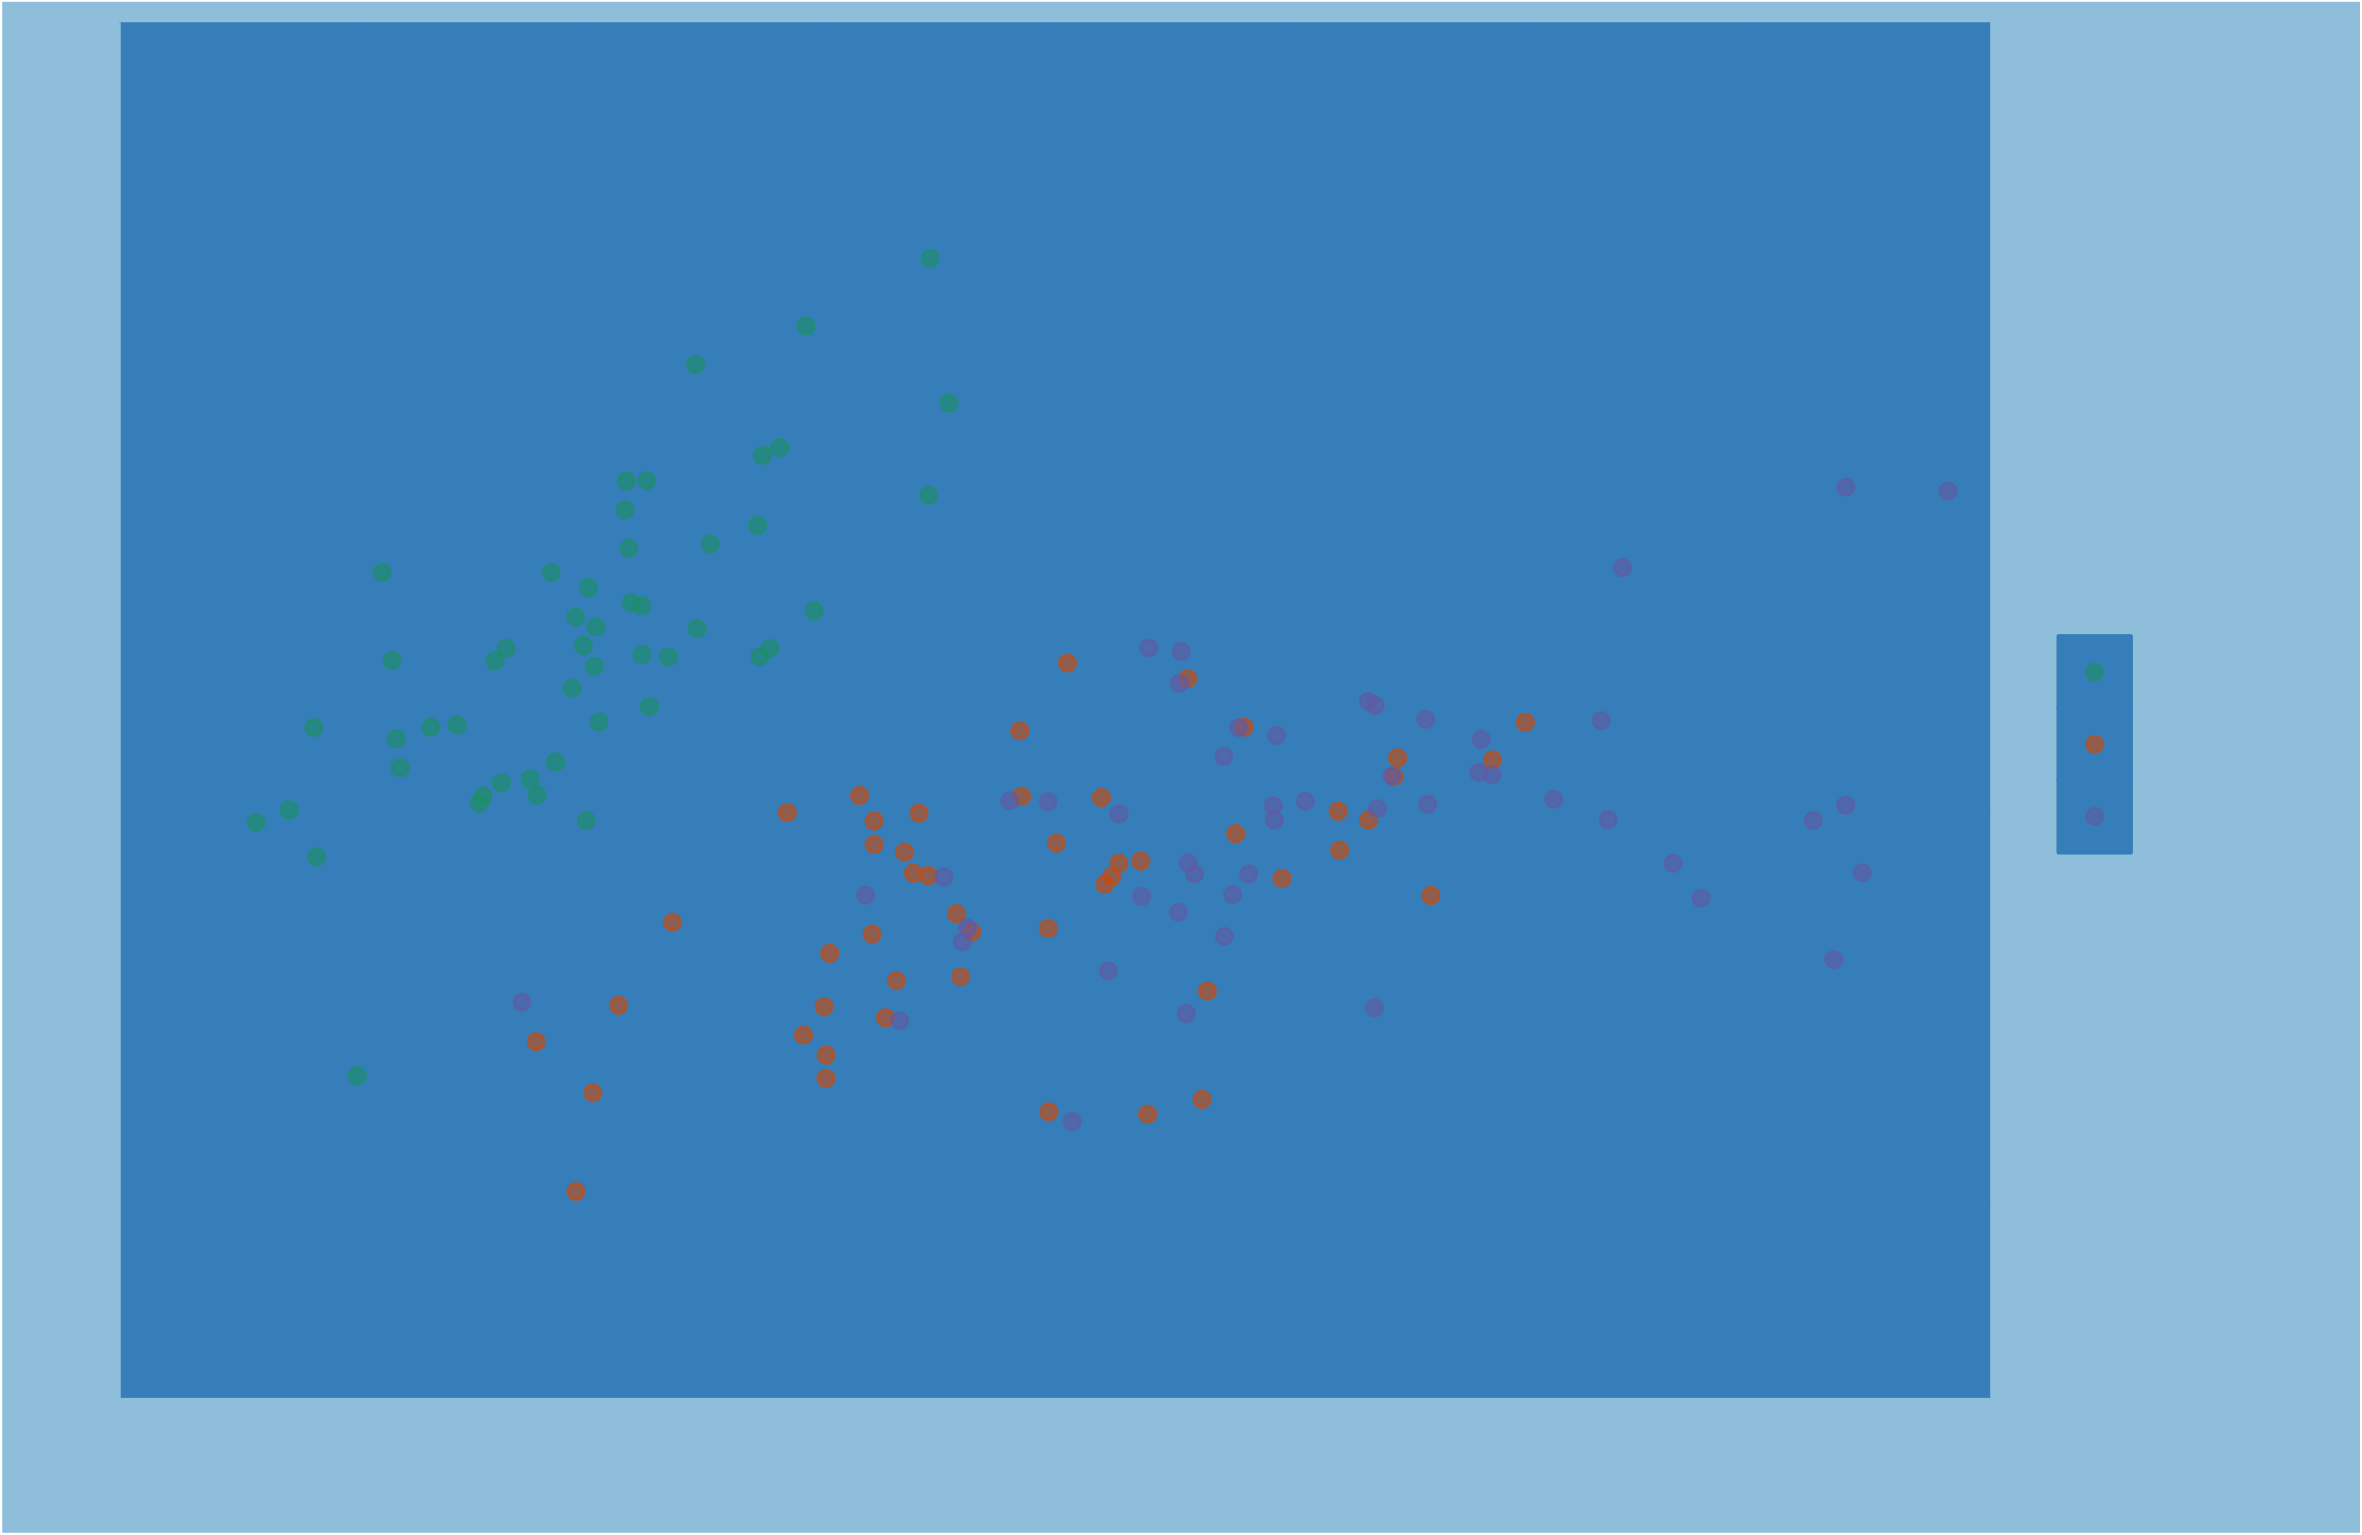
ggplot(iris, aes(x = Sepal.Length, y = Sepal.Width, color = Species)) +
geom_jitter(alpha = 0.6)


theme(
rect,
legend.background,
legend.key,
legend.box.background,
panel.background,
panel.border,
plot.background,
strip.background,
strip.background.x,
strip.background.y)
ex. Text
text
axis.title
axis.title.x
axis.title.x.top
axis.title.x.bottom
axis.title.y
axis.title.y.left
axis.title.y.right
ex. Linii
line
axis.ticks
axis.ticks.x
axis.ticks.x.top
axis.ticks.x.bottom
axis.ticks.y
axis.ticks.y.left,
axis.ticks.y.right
axis.line
axis.line.x
axis.line.x.top
axis.line.x.bottom
axis.line.y
axis.line.y.left
axis.line.y.right
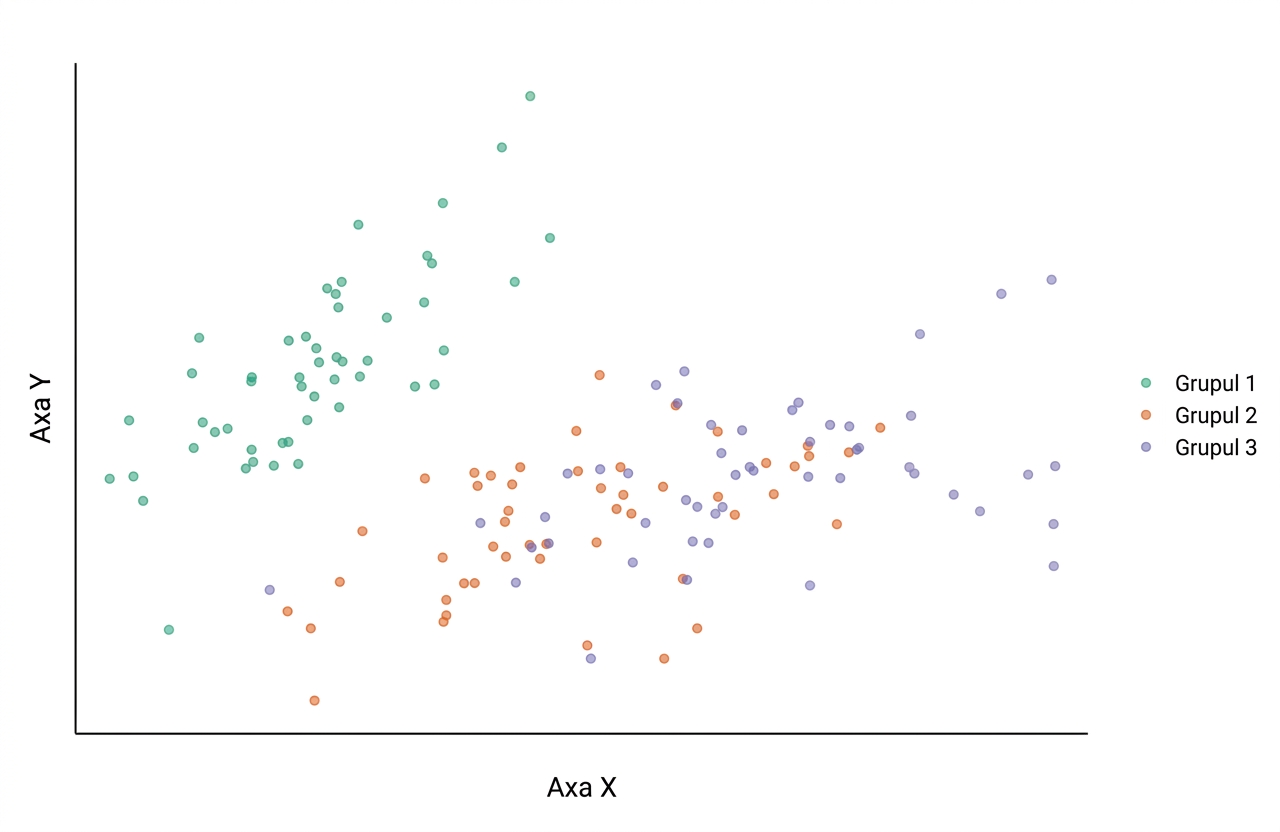
ggplot(iris, aes(x = Sepal.Length, y = Sepal.Width, color = Species)) +
geom_jitter(alpha = 0.6) +
theme(line = element_blank(),
rect = element_blank(),
text = element_blank())
Introducere în vizualizarea datelor cu ggplot2