Comparații cantitative: diagrame cu bare

Introducere în vizualizarea datelor cu Matplotlib

Ariel Rokem

Data Scientist

Medalii olimpice

,Gold, Silver, Bronze
United States, 137, 52, 67
Germany, 47, 43, 67
Great Britain, 64, 55, 26
Russia, 50, 28, 35
China, 44, 30, 35
France, 20, 55, 21
Australia, 23, 34, 25
Italy, 8, 38, 24
Canada, 4, 4, 61
Japan, 17, 13, 34
Introducere în vizualizarea datelor cu Matplotlib

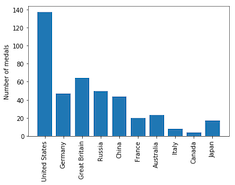
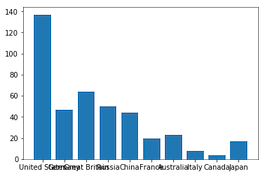
Medalii olimpice: vizualizarea datelor

medals = pd.read_csv('medals_by_country_2016.csv', index_col=0)

fig, ax = plt.subplots()
ax.bar(medals.index, medals["Gold"]) plt.show()
Introducere în vizualizarea datelor cu Matplotlib

Rotirea etichetelor axei

fig, ax = plt.subplots()
ax.bar(medals.index, medals["Gold"])

ax.set_xticklabels(medals.index, rotation=90) ax.set_ylabel("Number of medals")
plt.show()
Introducere în vizualizarea datelor cu Matplotlib

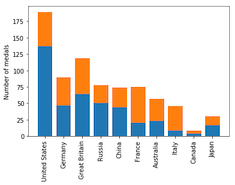
Medalii olimpice: vizualizarea celorlalte medalii

fig, ax = plt.subplots
ax.bar(medals.index, medals["Gold"])

ax.bar(medals.index, medals["Silver"], bottom=medals["Gold"])
ax.set_xticklabels(medals.index, rotation=90) ax.set_ylabel("Number of medals") plt.show()

Introducere în vizualizarea datelor cu Matplotlib

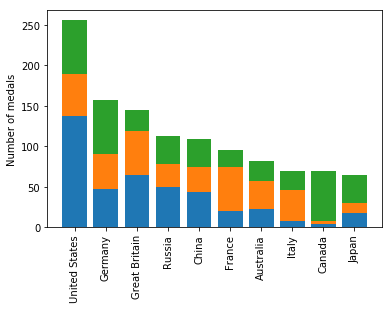
Medalii olimpice: vizualizarea tuturor celor trei

fig, ax = plt.subplots
ax.bar(medals.index, medals["Gold"])

ax.bar(medals.index, medals["Silver"], bottom=medals["Gold"])

ax.bar(medals.index, medals["Bronze"], bottom=medals["Gold"] + medals["Silver"])
ax.set_xticklabels(medals.index, rotation=90) ax.set_ylabel("Number of medals") plt.show()
Introducere în vizualizarea datelor cu Matplotlib

Diagramă cu bare stivuite

Introducere în vizualizarea datelor cu Matplotlib

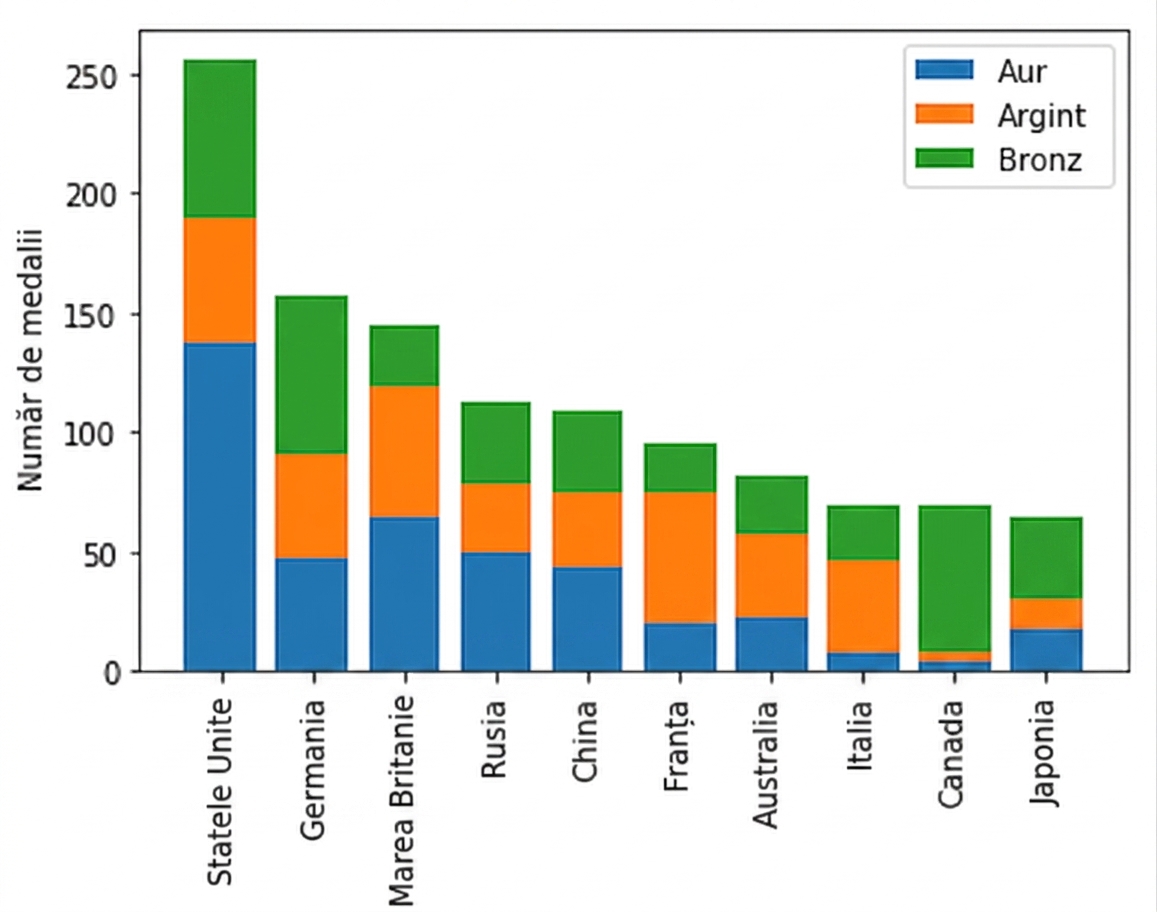
Adăugarea unei legende

fig, ax = plt.subplots
ax.bar(medals.index, medals["Gold"])
ax.bar(medals.index, medals["Silver"], bottom=medals["Gold"])
ax.bar(medals.index, medals["Bronze"],
       bottom=medals["Gold"] + medals["Silver"])

ax.set_xticklabels(medals.index, rotation=90)
ax.set_ylabel("Number of medals")
Introducere în vizualizarea datelor cu Matplotlib

Adăugarea unei legende

fig, ax = plt.subplots
ax.bar(medals.index, medals["Gold"], label="Gold")
ax.bar(medals.index, medals["Silver"], bottom=medals["Gold"], 
       label="Silver")
ax.bar(medals.index, medals["Bronze"],
       bottom=medals["Gold"] + medals["Silver"], 
       label="Bronze")

ax.set_xticklabels(medals.index, rotation=90)
ax.set_ylabel("Number of medals")

ax.legend() plt.show()
Introducere în vizualizarea datelor cu Matplotlib

Diagramă cu bare stivuite și legendă

Introducere în vizualizarea datelor cu Matplotlib

Creați o diagramă cu bare!

Introducere în vizualizarea datelor cu Matplotlib

Preparing Video For Download...