Introducere în Python pentru finanțe
Adina Howe
Professor
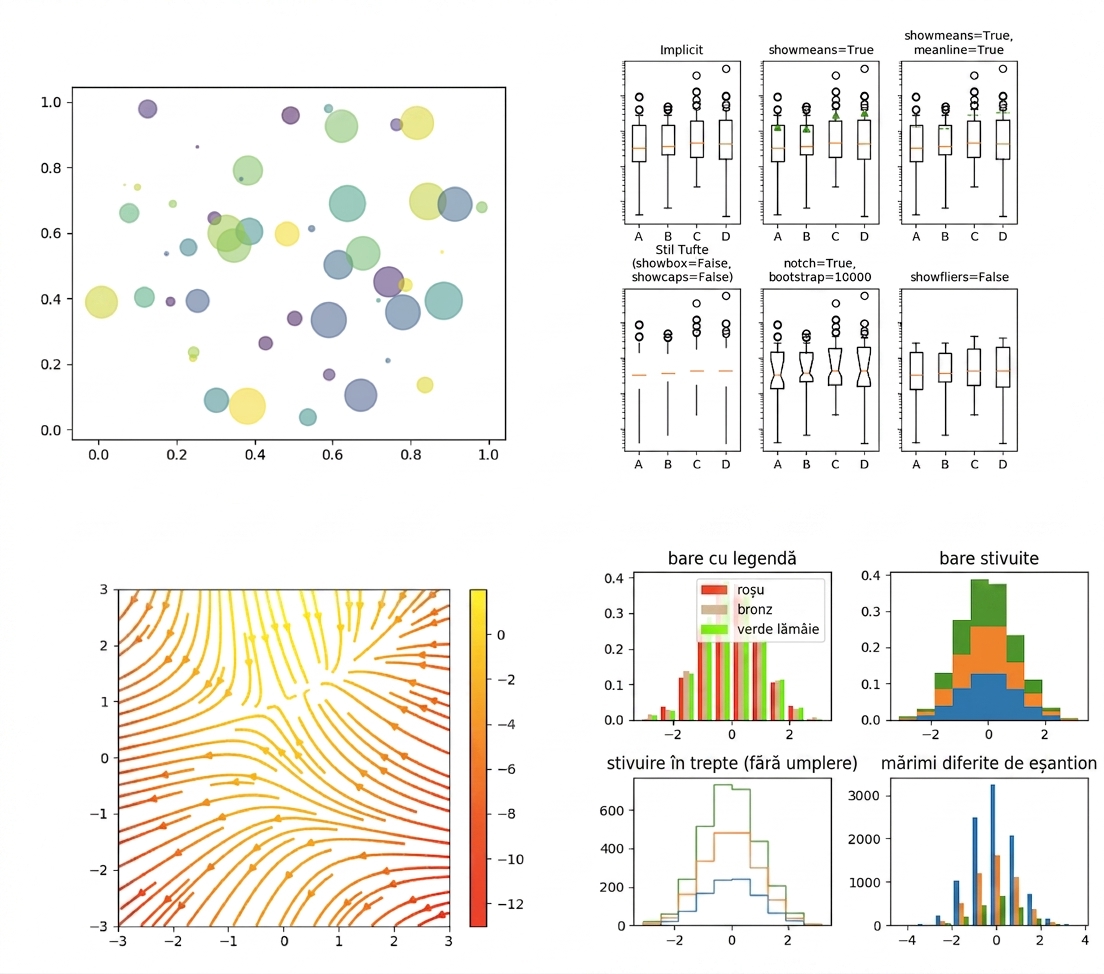
Explorați galeria Matplotlib accesând acest link.
import matplotlib.pyplot as plt
plt.plot()
plt.show()
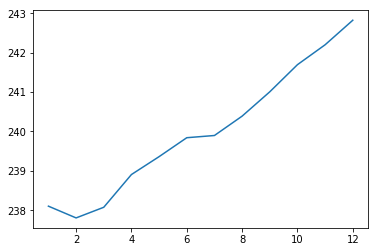
import matplotlib.pyplot as plt
plt.plot(months, prices)
plt.show()

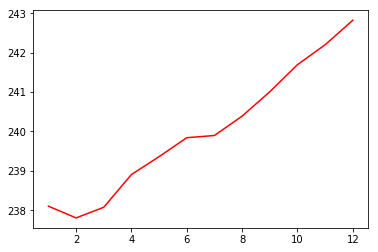
import matplotlib.pyplot as plt
plt.plot(months, prices, color = 'red')
plt.show()

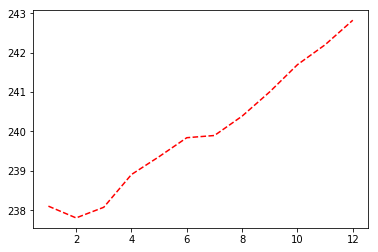
import matplotlib.pyplot as plt
plt.plot(months, prices, color = 'red', linestyle = '--')
plt.show()

| color | |
|---|---|
| 'green' | verde |
| 'red' | roșu |
| 'cyan' | cyan |
| 'blue' | albastru |
| linestyle | |
|---|---|
| '-' | linie continuă |
| '--' | linie întreruptă |
| '-.' | linie punct-linie |
| ':' | punctată |
Mai multă documentație despre culori și linii găsiți aici.
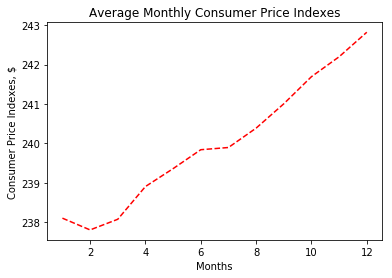
import matplotlib.pyplot as plt
plt.plot(months, prices, color = 'red', linestyle = '--')
# Add labels
plt.xlabel('Months')
plt.ylabel('Consumer Price Indexes, $')
plt.title('Average Monthly Consumer Price Indexes')
# Show plot
plt.show()

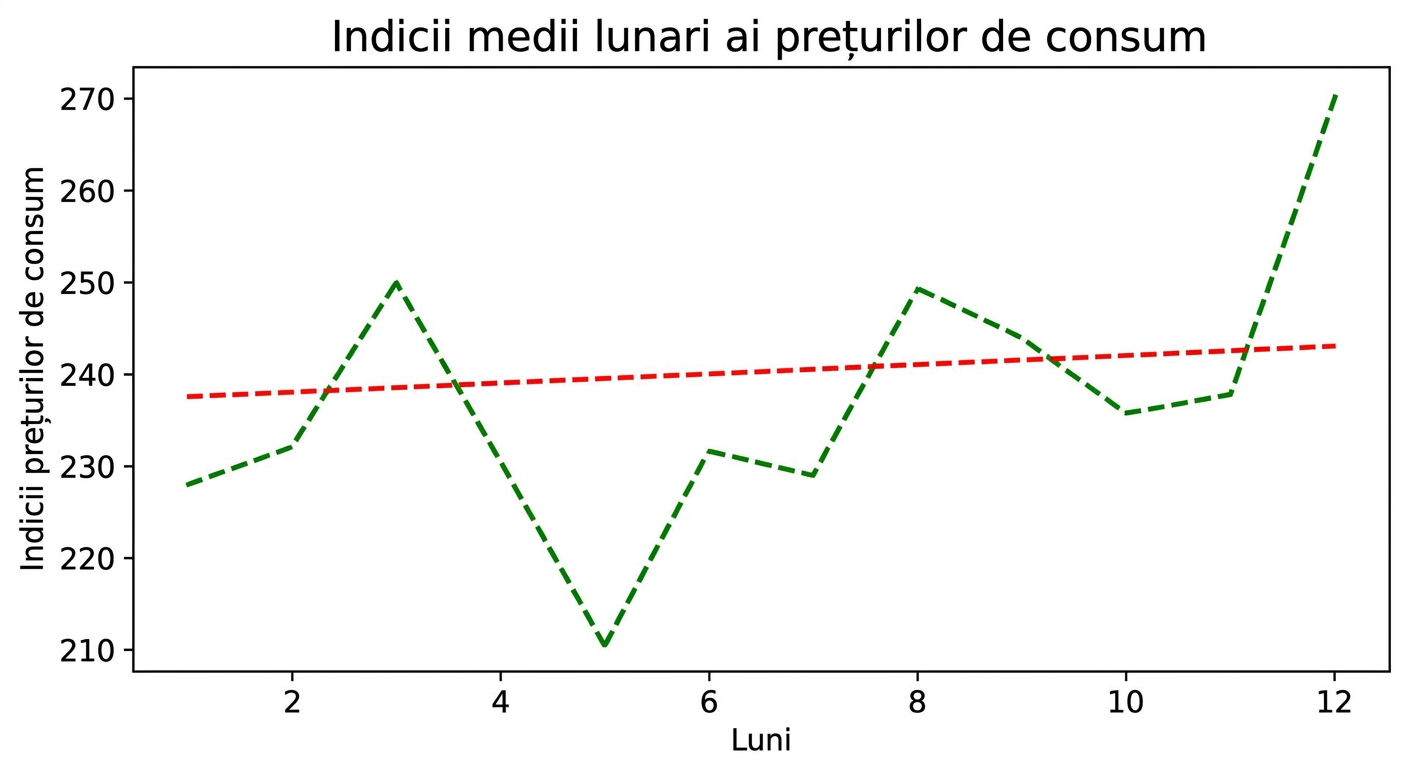
import matplotlib.pyplot as plt
plt.plot(months, prices, color = 'red', linestyle = '--')
# adding an additional line
plt.plot(months, prices_new, color = 'green', linestyle = '--')
plt.xlabel('Months')
plt.ylabel('Consumer Price Indexes, $')
plt.title('Average Monthly Consumer Price Indexes')
plt.show()

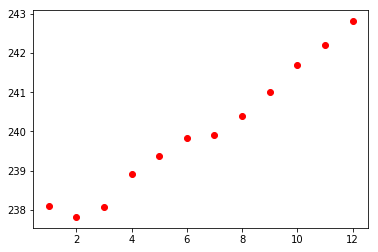
import matplotlib.pyplot as plt
plt.scatter(x = months, y = prices, color = 'red')
plt.show()

Introducere în Python pentru finanțe