Testele chi-pătrat de bunătate a ajustării
Testarea ipotezelor în Python

James Chapman
Curriculum Manager, DataCamp
Linkuri violet
Cum vă simțiți când descoperiți că ați vizitat deja resursa principală?
purple_link_counts = stack_overflow['purple_link'].value_counts()
purple_link_counts = purple_link_counts.rename_axis('purple_link')\
                                       .reset_index(name='n')\
                                       .sort_values('purple_link')
         purple_link     n
2             Amused   368
3            Annoyed   263
0  Hello, old friend  1225
1        Indifferent   405
Formularea ipotezelor
hypothesized = pd.DataFrame({
  'purple_link': ['Amused', 'Annoyed', 'Hello, old friend', 'Indifferent'],
  'prop': [1/6, 1/6, 1/2, 1/6]})
         purple_link      prop
0             Amused  0.166667
1            Annoyed  0.166667
2  Hello, old friend  0.500000
3        Indifferent  0.166667
$H_{0}$: Eșantionul corespunde distribuției ipotezate
$H_{A}$: Eșantionul nu corespunde distribuției ipotezate
$\chi^{2}$ măsoară abaterea rezultatelor observate față de cele așteptate în fiecare grup
alpha = 0.01
Frecvențe ipotezate pe categorie
n_total = len(stack_overflow)
hypothesized["n"] = hypothesized["prop"] * n_total
         purple_link      prop            n
0             Amused  0.166667   376.833333
1            Annoyed  0.166667   376.833333
2  Hello, old friend  0.500000  1130.500000
3        Indifferent  0.166667   376.833333
Vizualizarea frecvențelor
import matplotlib.pyplot as plt plt.bar(purple_link_counts['purple_link'], purple_link_counts['n'], color='red', label='Observed')plt.bar(hypothesized['purple_link'], hypothesized['n'], alpha=0.5, color='blue', label='Hypothesized') plt.legend() plt.show()
Vizualizarea frecvențelor
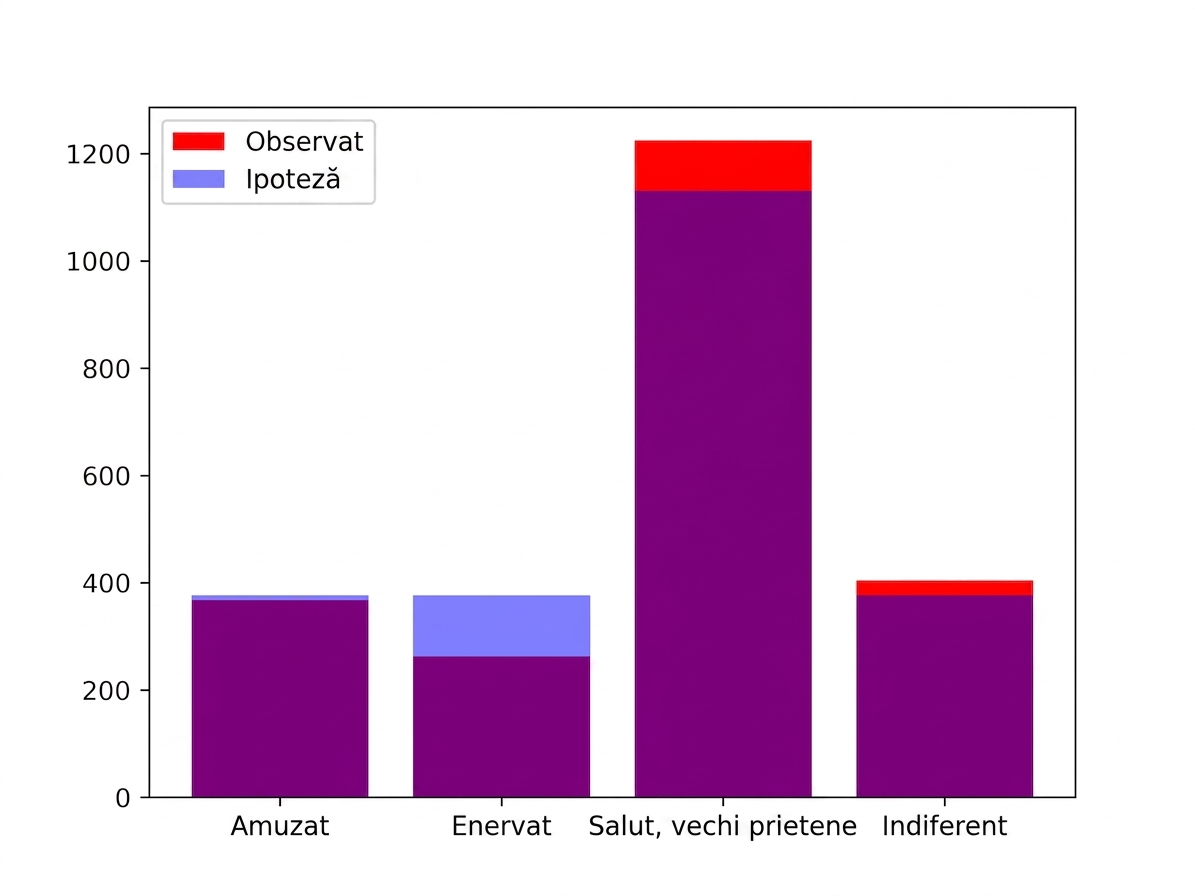
Testul chi-pătrat de bunătate a ajustării
print(hypothesized)
         purple_link      prop            n
0             Amused  0.166667   376.833333
1            Annoyed  0.166667   376.833333
2  Hello, old friend  0.500000  1130.500000
3        Indifferent  0.166667   376.833333
from scipy.stats import chisquare
chisquare(f_obs=purple_link_counts['n'], f_exp=hypothesized['n'])
Power_divergenceResult(statistic=44.59840778416629, pvalue=1.1261810719413759e-09)
Vamos praticar!
Testarea ipotezelor în Python

