Mean, variance, and normal distribution
Introduction to Portfolio Risk Management in Python

Dakota Wixom
Quantitative Analyst | QuantCourse.com
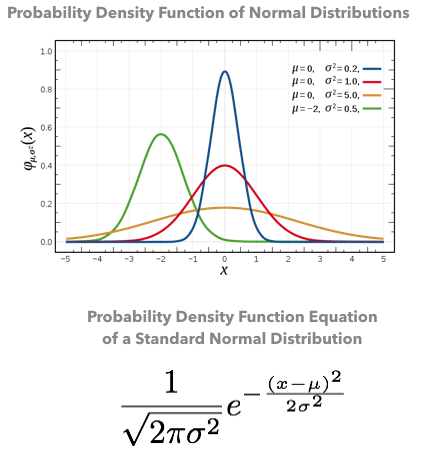
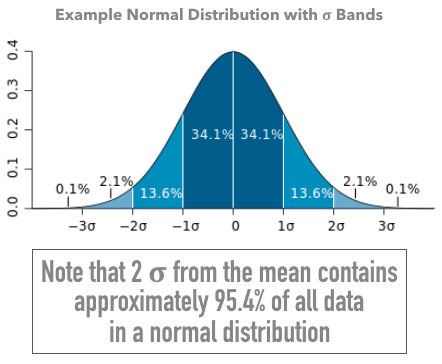
Comparing against a normal distribution
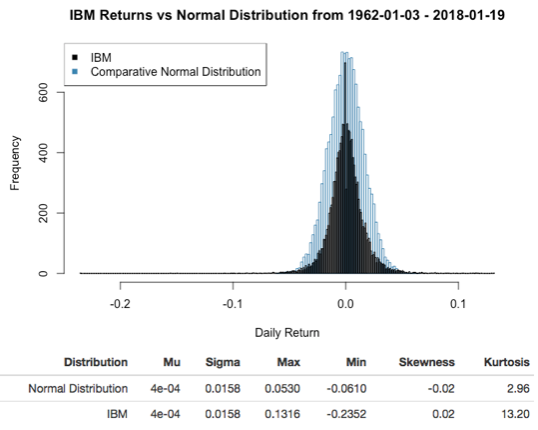
Standard deviation and variance
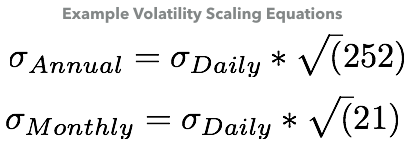
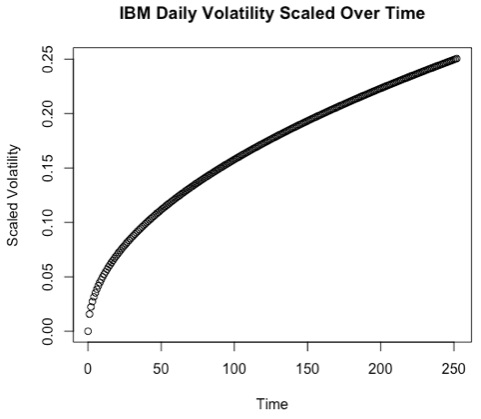
Scaling volatility
- Volatility scales with the square root of time
- You can normally assume 252 trading days in a given year, and 21 trading days in a given month