Estimating tail risk

Introduction to Portfolio Risk Management in Python

Dakota Wixom

Quantitative Analyst | QuantCourse.com
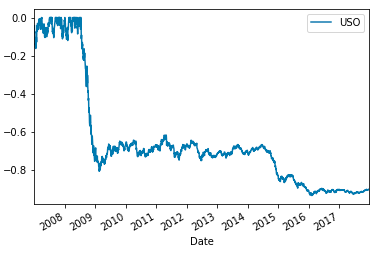
Estimating tail risk

Tail risk is the risk of extreme investment outcomes, most notably on the negative side of a distribution.

  • Historical Drawdown
  • Value at Risk
  • Conditional Value at Risk
  • Monte-Carlo Simulation
Introduction to Portfolio Risk Management in Python

Historical drawdown

Drawdown is the percentage loss from the highest cumulative historical point.

$$ \text{Drawdown} = \frac{r_t}{RM} - 1$$

  • $r_t$: Cumulative return at time t
  • $RM$: Running maximum
Historical Drawdown of the USO Oil ETF

Introduction to Portfolio Risk Management in Python

Historical drawdown in Python

Assuming cum_rets is an np.array of cumulative returns over time

running_max = np.maximum.accumulate(cum_rets)
running_max[running_max < 1] = 1
drawdown = (cum_rets) / running_max - 1
drawdown
Date        Return
2007-01-03    -0.042636
2007-01-04    -0.081589
2007-01-05    -0.073062
Introduction to Portfolio Risk Management in Python

Historical Value at Risk

Value at Risk, or VaR, is a threshold with a given confidence level that losses will not (or more accurately, will not historically) exceed a certain level.

VaR is commonly quoted with quantiles such as 95, 99, and 99.9.

Example: VaR(95) = -2.3%

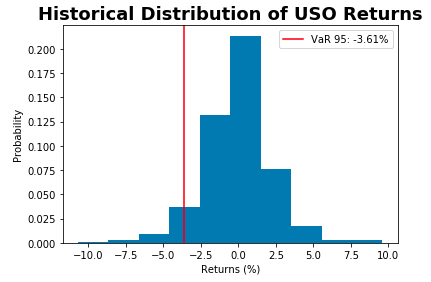
95% certain that losses will not exceed -2.3% in a given day based on historical values.

Introduction to Portfolio Risk Management in Python

Historical Value at Risk in Python

var_level = 95
var_95 = np.percentile(StockReturns, 100 - var_level)
var_95
-0.023
Introduction to Portfolio Risk Management in Python

Historical expected shortfall

Conditional Value at Risk, or CVaR, is an estimate of expected losses sustained in the worst 1 - x% of scenarios.

CVaR is commonly quoted with quantiles such as 95, 99, and 99.9.


Example: CVaR(95) = -2.5%


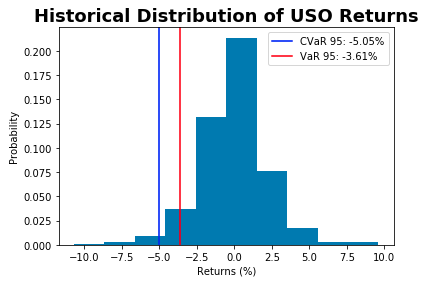
In the worst 5% of cases, losses were on average exceed -2.5% historically.

Introduction to Portfolio Risk Management in Python

Historical expected shortfall in Python

Assuming you have an object StockReturns which is a time series of stock returns.

To calculate historical CVaR(95):

var_level = 95
var_95 = np.percentile(StockReturns, 100 - var_level)
cvar_95 = StockReturns[StockReturns <= var_95].mean()
cvar_95
-0.025
Introduction to Portfolio Risk Management in Python

Let's practice!

Introduction to Portfolio Risk Management in Python

Preparing Video For Download...