Financial returns
Introduction to Portfolio Risk Management in Python

Dakota Wixom
Quantitative Analyst | QuantCourse.com
Course overview
Learn how to analyze investment return distributions, build portfolios and reduce risk, and identify key factors which are driving portfolio returns.
- Univariate Investment Risk
- Portfolio Investing
- Factor Investing
- Forecasting and Reducing Risk
Investment risk
What is Risk?
- Risk in financial markets is a measure of uncertainty
- Dispersion or variance of financial returns
How do you typically measure risk?
- Standard deviation or variance of daily returns
- Kurtosis of the daily returns distribution
- Skewness of the daily returns distribution
- Historical drawdown
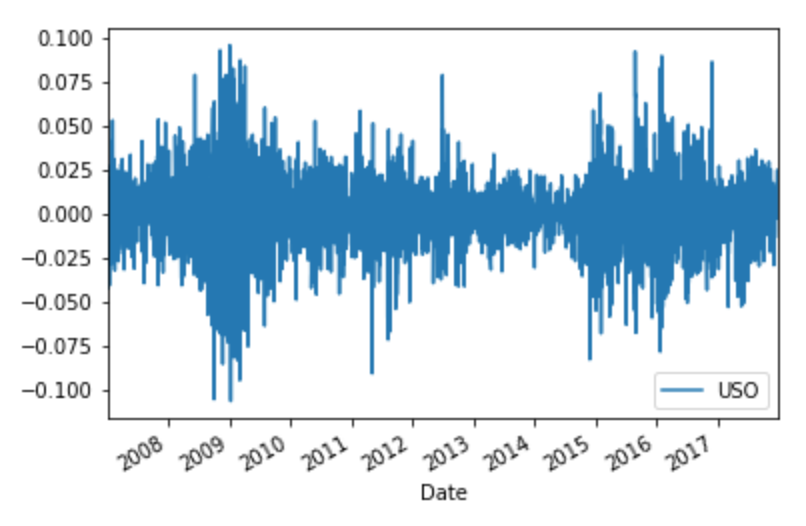
Financial risk
Returns

Probability

A tale of two returns
- Returns are derived from stock prices
- Discrete returns (simple returns) are the most commonly used, and represent periodic (e.g. daily, weekly, monthly, etc.) price movements
- Log returns are often used in academic research and financial modeling. They assume continuous compounding.

Calculating stock returns
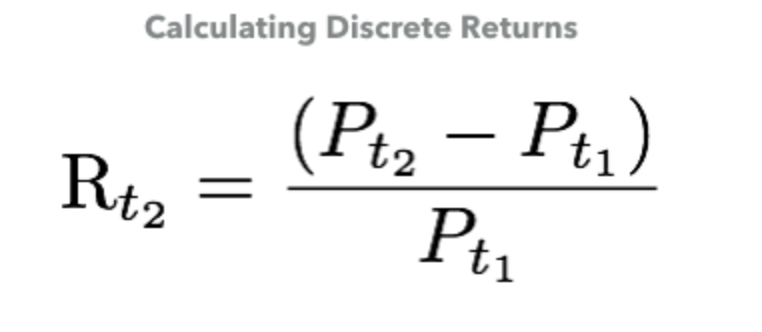
- Discrete returns are calculated as the change in price as a percentage of the previous period's price

Calculating log returns
- Log returns are calculated as the difference between the log of two prices
- Log returns aggregate across time, while discrete returns aggregate across assets
$$ Rl = \ln(\frac{P_{t_2}}{P_{t_1}}) $$
or equivalently
$$ Rl = \ln(P_{t_2}) - \ln(P_{t_1}) $$
Calculating stock returns in Python
Step 1:
Load in stock prices data and store it as a pandas DataFrame organized by date:
import pandas as pd
StockPrices = pd.read_csv('StockData.csv', parse_dates=['Date'])
StockPrices = StockPrices.sort_values(by='Date')
StockPrices.set_index('Date', inplace=True)
Calculating stock Returns in Python
Step 2:
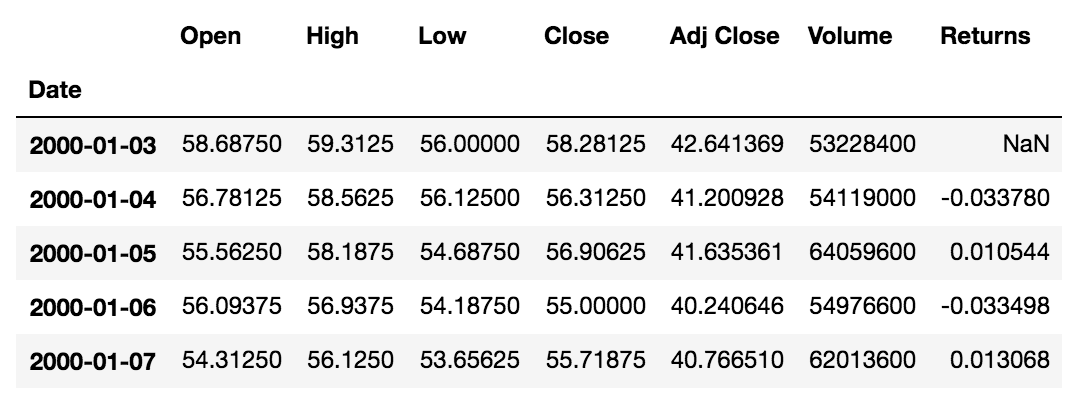
Calculate daily returns of the adjusted close prices and append the returns as a new column in the DataFrame.
StockPrices["Returns"] = StockPrices["Adj Close"].pct_change()
StockPrices["Returns"].head()

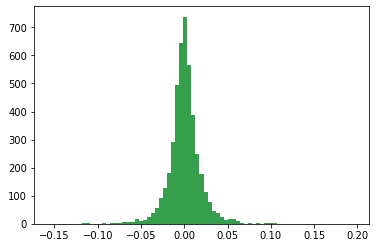
Visualizing return distributions
import matplotlib.pyplot as plt
plt.hist(StockPrices["Returns"].dropna(), bins=75, density=False)
plt.show()

Let's practice!
Introduction to Portfolio Risk Management in Python

