कस्टमाइज़ेशन

इंटरमीडिएट Python

Hugo Bowne-Anderson

Data Scientist at DataCamp

डेटा विज़ुअलाइज़ेशन

  • कई विकल्प

    • अलग-अलग प्लॉट प्रकार

    • ढेरों कस्टमाइज़ेशन

  • चुनाव निर्भर करता है

    • डेटा पर

    • जो कहानी आप बताना चाहते हैं

इंटरमीडिएट Python

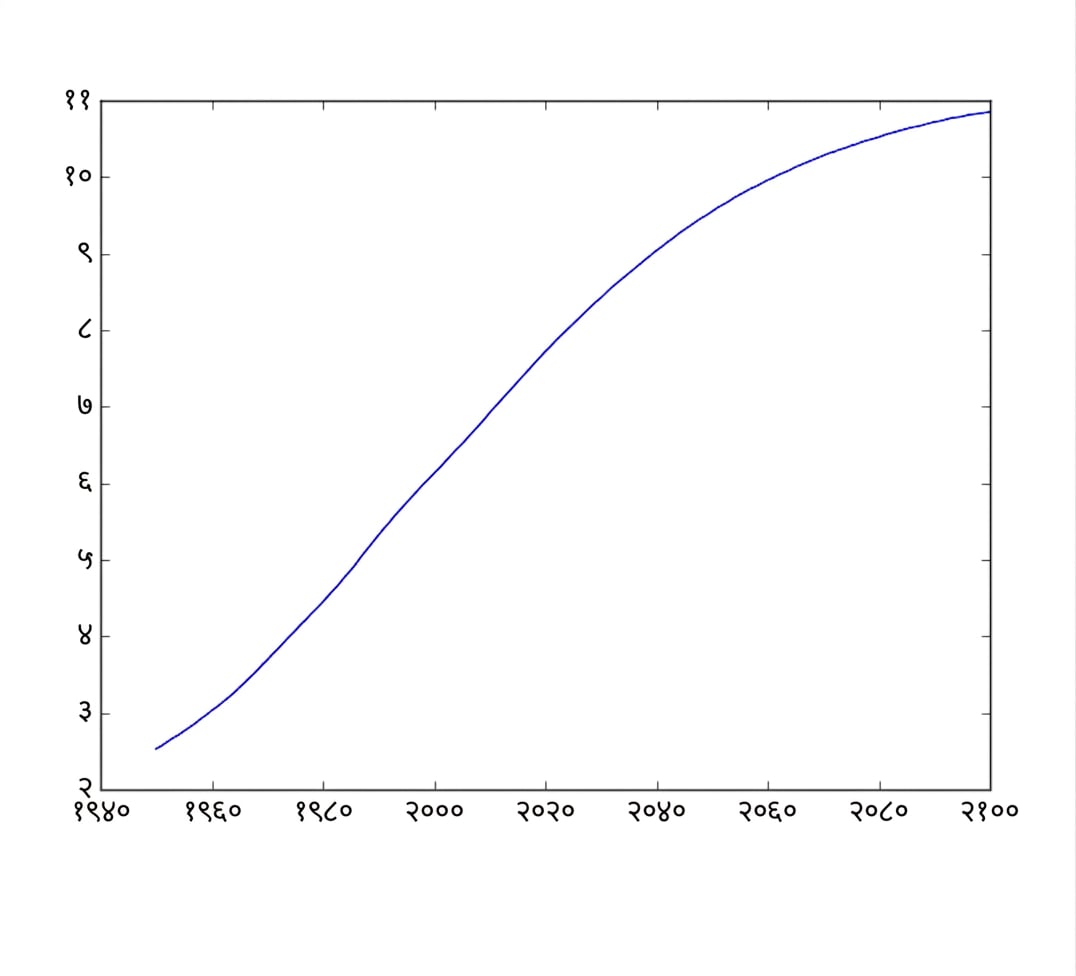
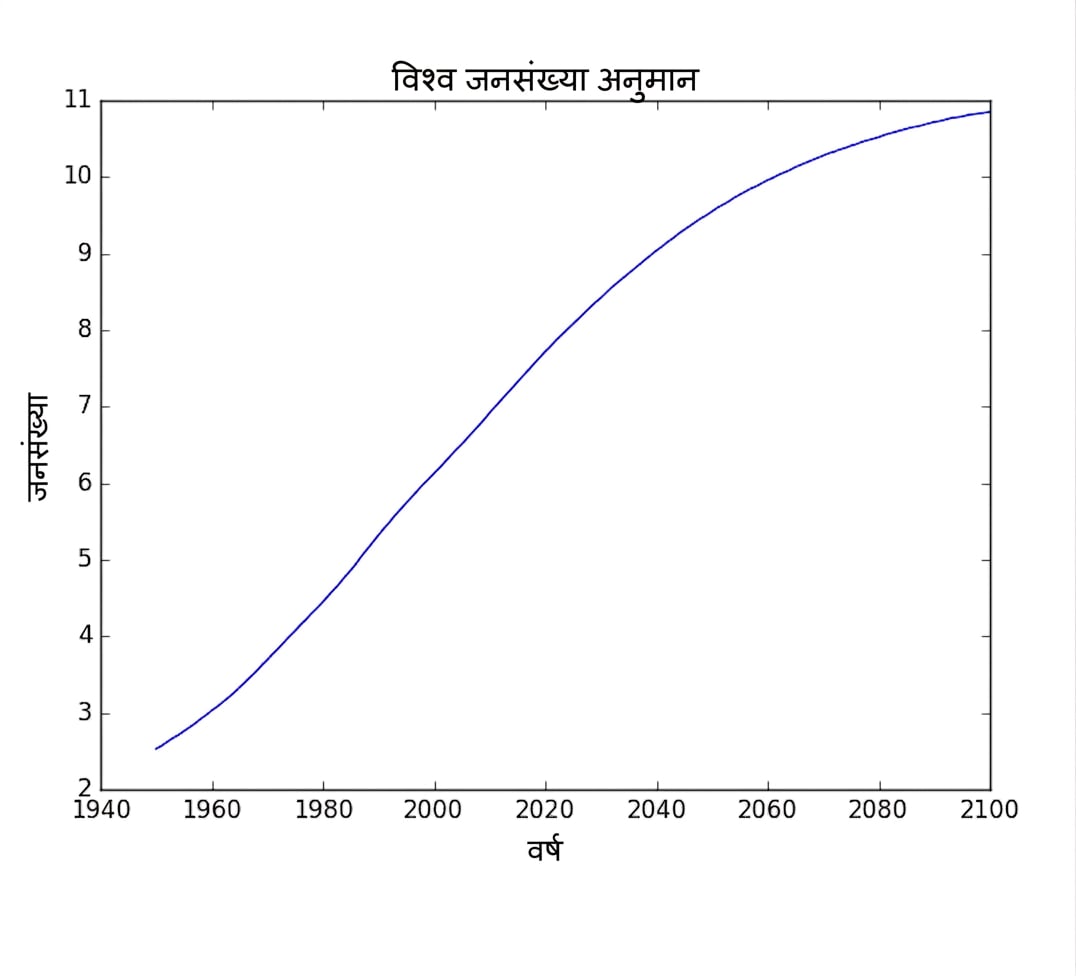
बेसिक प्लॉट

population.py

import matplotlib.pyplot as plt
year = [1950, 1951, 1952, ..., 2100]
pop = [2.538, 2.57, 2.62, ..., 10.85]

plt.plot(year, pop)

plt.show()

ch1_3_slides.012.png

इंटरमीडिएट Python

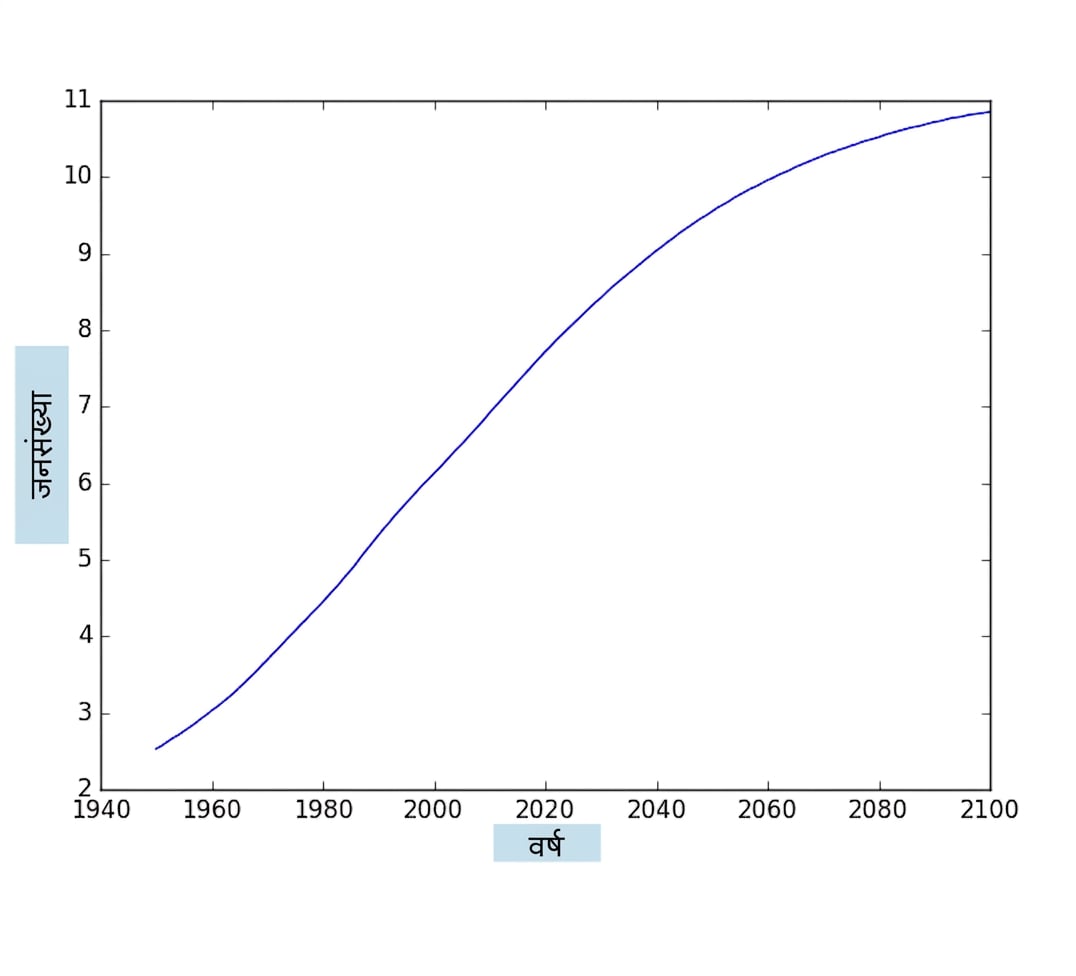
एक्सिस लेबल्स

population.py

import matplotlib.pyplot as plt
year = [1950, 1951, 1952, ..., 2100] 
pop = [2.538, 2.57, 2.62, ..., 10.85]

plt.plot(year, pop)

plt.xlabel('Year') plt.ylabel('Population')
plt.show()

ch1_3_slides.012.png

इंटरमीडिएट Python

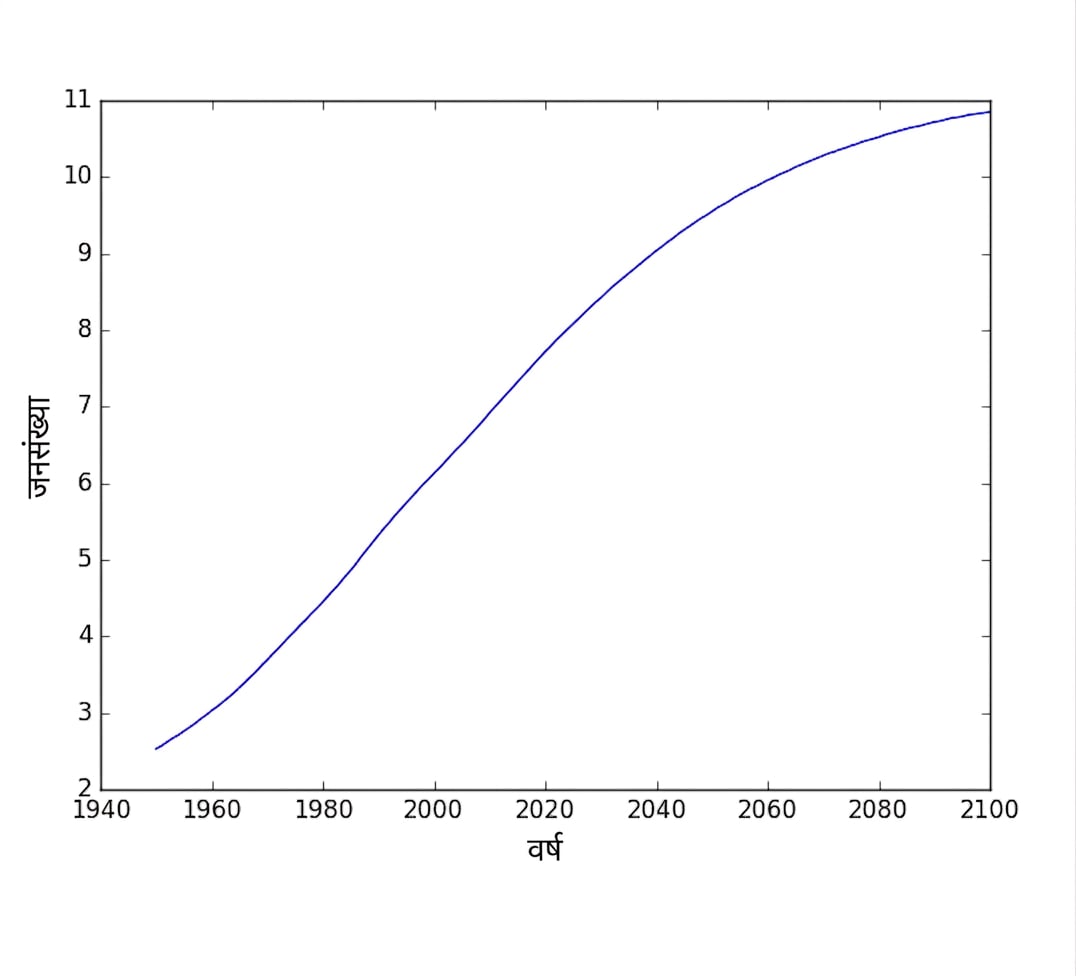
एक्सिस लेबल्स

population.py

import matplotlib.pyplot as plt
year = [1950, 1951, 1952, ..., 2100] 
pop = [2.538, 2.57, 2.62, ..., 10.85]

plt.plot(year, pop)

plt.xlabel('Year') plt.ylabel('Population')
plt.show()

ch1_3_slides.014.png

इंटरमीडिएट Python

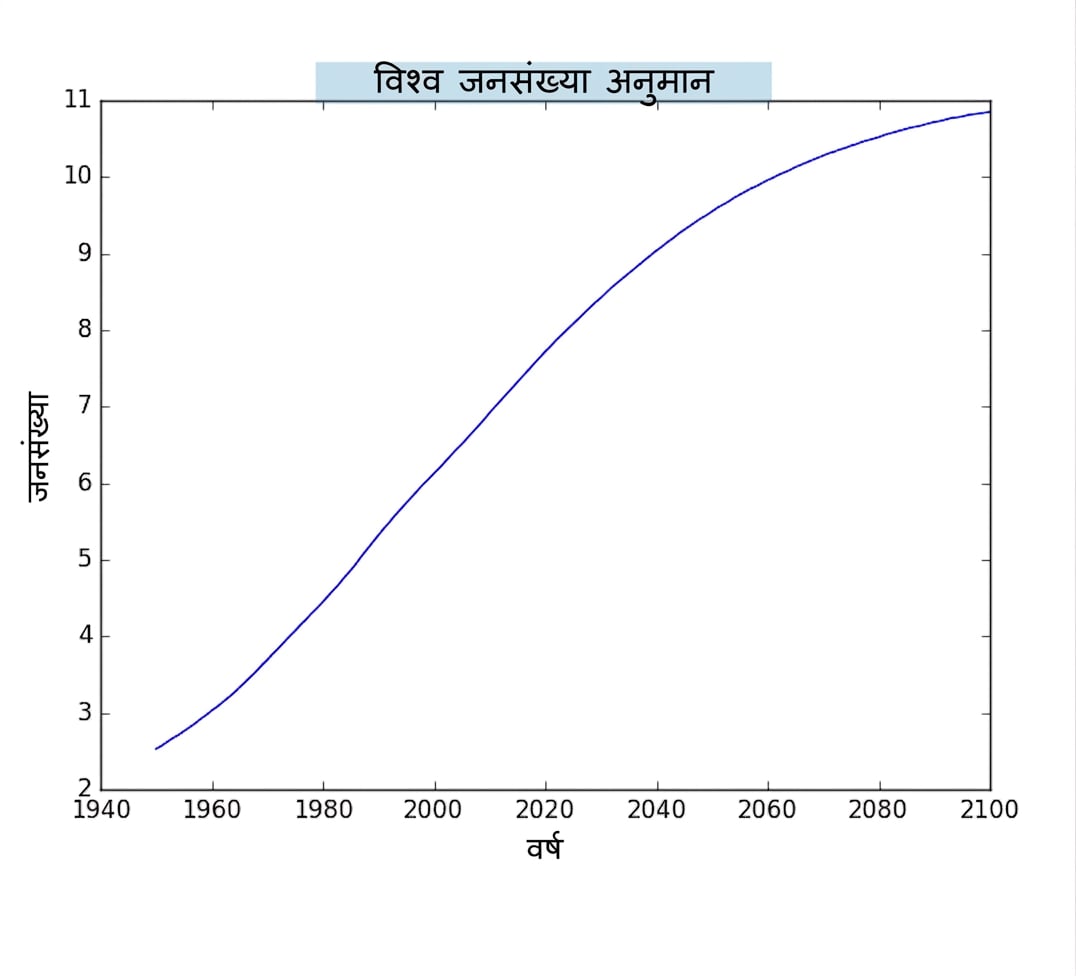
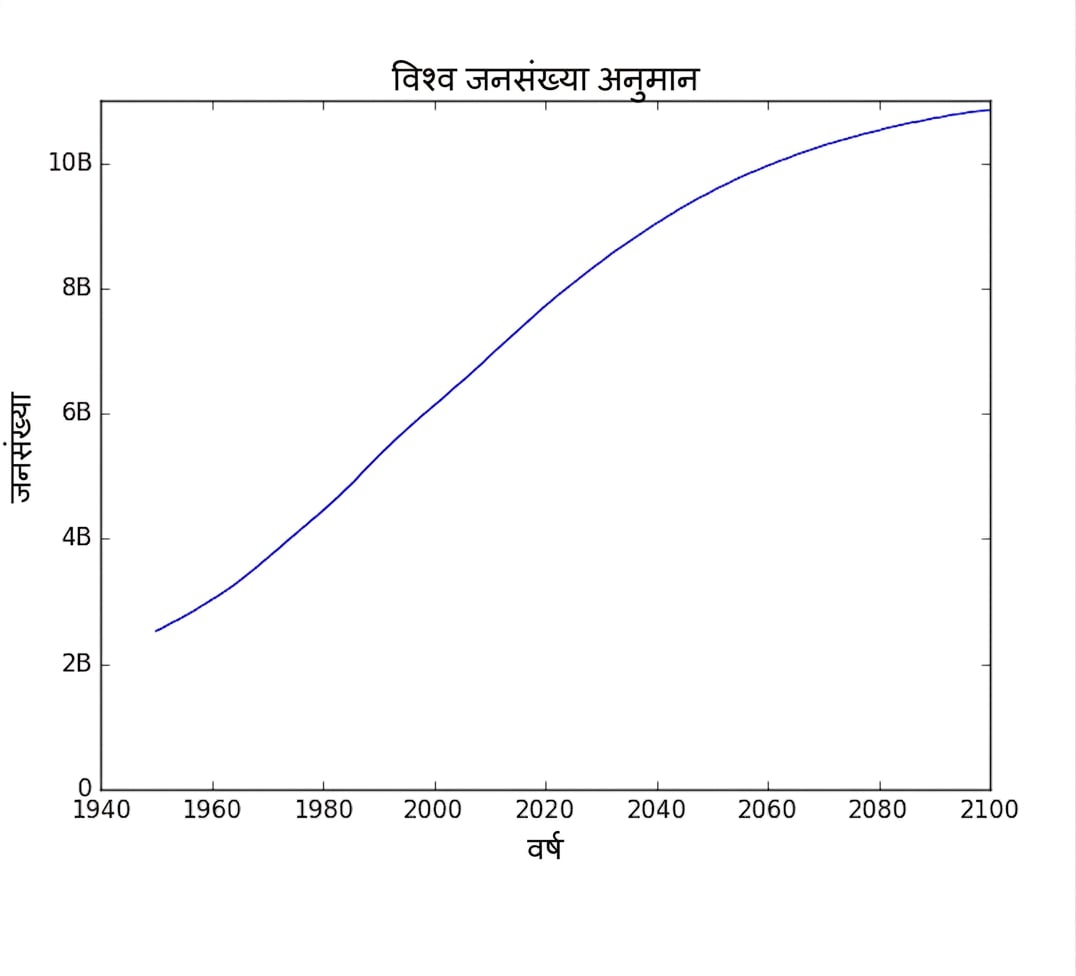
शीर्षक

population.py

import matplotlib.pyplot as plt
year = [1950, 1951, 1952, ..., 2100] 
pop = [2.538, 2.57, 2.62, ..., 10.85]

plt.plot(year, pop)

plt.xlabel('Year') plt.ylabel('Population')
plt.title('World Population Projections')
plt.show()

ch1_3_slides.015.png

इंटरमीडिएट Python

शीर्षक

population.py

import matplotlib.pyplot as plt
year = [1950, 1951, 1952, ..., 2100] 
pop = [2.538, 2.57, 2.62, ..., 10.85]

plt.plot(year, pop)

plt.xlabel('Year') plt.ylabel('Population')
plt.title('World Population Projections')
plt.show()

ch1_3_slides.017.png

इंटरमीडिएट Python

टिक्स

population.py

import matplotlib.pyplot as plt
year = [1950, 1951, 1952, ..., 2100] 
pop = [2.538, 2.57, 2.62, ..., 10.85]

plt.plot(year, pop)

plt.xlabel('Year') plt.ylabel('Population')
plt.title('World Population Projections')
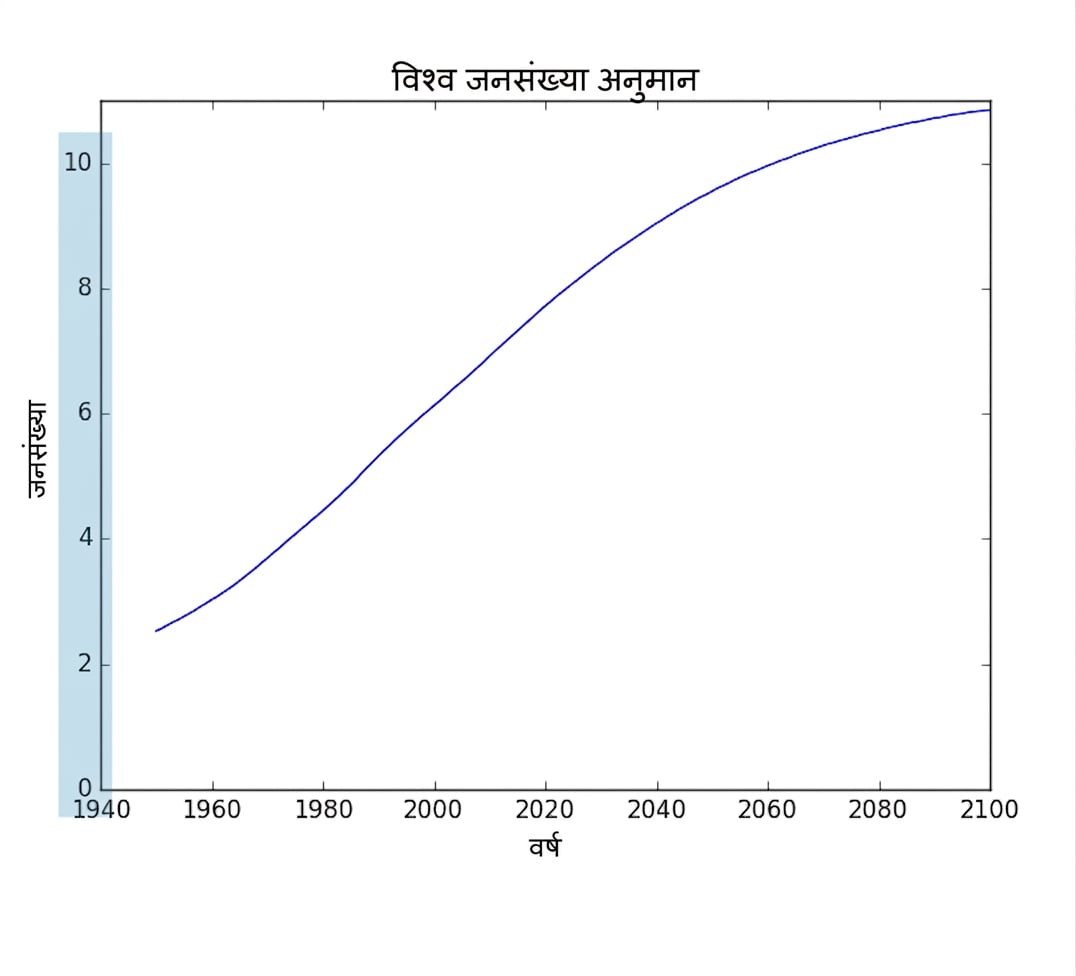
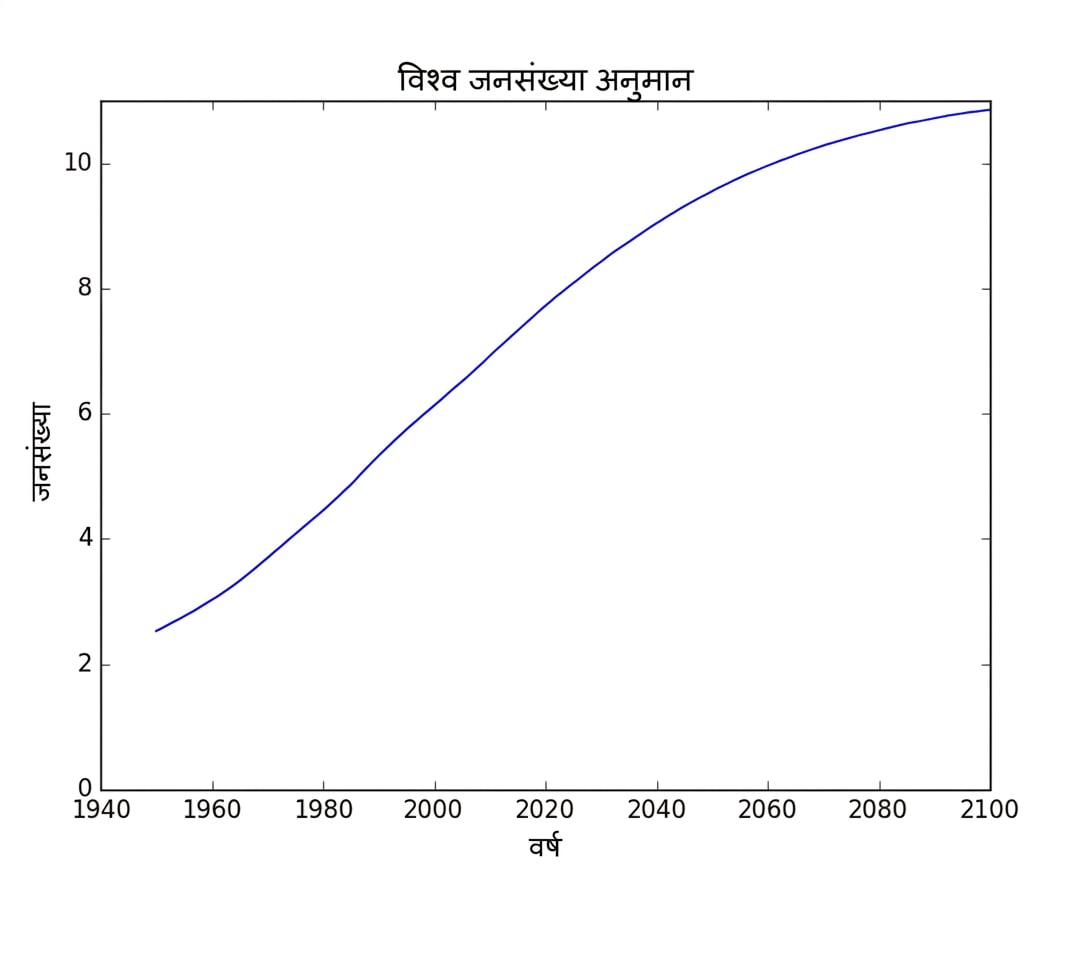
plt.yticks([0, 2, 4, 6, 8, 10])
plt.show()

ch1_3_slides.019.png

इंटरमीडिएट Python

टिक्स

population.py

import matplotlib.pyplot as plt
year = [1950, 1951, 1952, ..., 2100] 
pop = [2.538, 2.57, 2.62, ..., 10.85]

plt.plot(year, pop)

plt.xlabel('Year') plt.ylabel('Population')
plt.title('World Population Projections')
plt.yticks([0, 2, 4, 6, 8, 10])
plt.show()

ch1_3_slides.020.png

इंटरमीडिएट Python

टिक्स (2)

population.py

import matplotlib.pyplot as plt
year = [1950, 1951, 1952, ..., 2100] 
pop = [2.538, 2.57, 2.62, ..., 10.85]

plt.plot(year, pop)

plt.xlabel('Year') plt.ylabel('Population')
plt.title('World Population Projections')
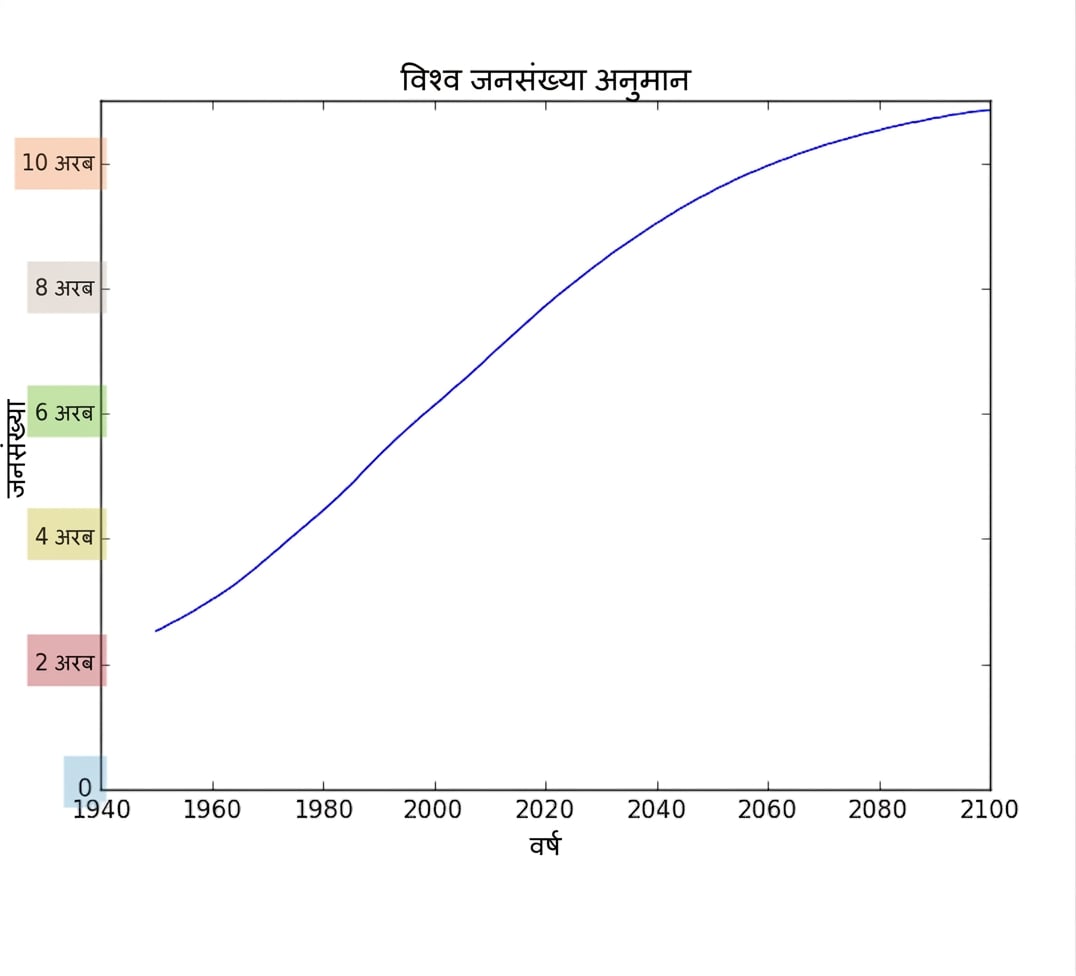
plt.yticks([0, 2, 4, 6, 8, 10],
['0', '2B', '4B', '6B', '8B', '10B'])
plt.show()

ch1_3_slides.021.png

इंटरमीडिएट Python

टिक्स (2)

population.py

import matplotlib.pyplot as plt
year = [1950, 1951, 1952, ..., 2100] 
pop = [2.538, 2.57, 2.62, ..., 10.85]

plt.plot(year, pop)

plt.xlabel('Year') plt.ylabel('Population')
plt.title('World Population Projections')
plt.yticks([0, 2, 4, 6, 8, 10],
['0', '2B', '4B', '6B', '8B', '10B'])
plt.show()

ch1_3_slides.027.png

इंटरमीडिएट Python

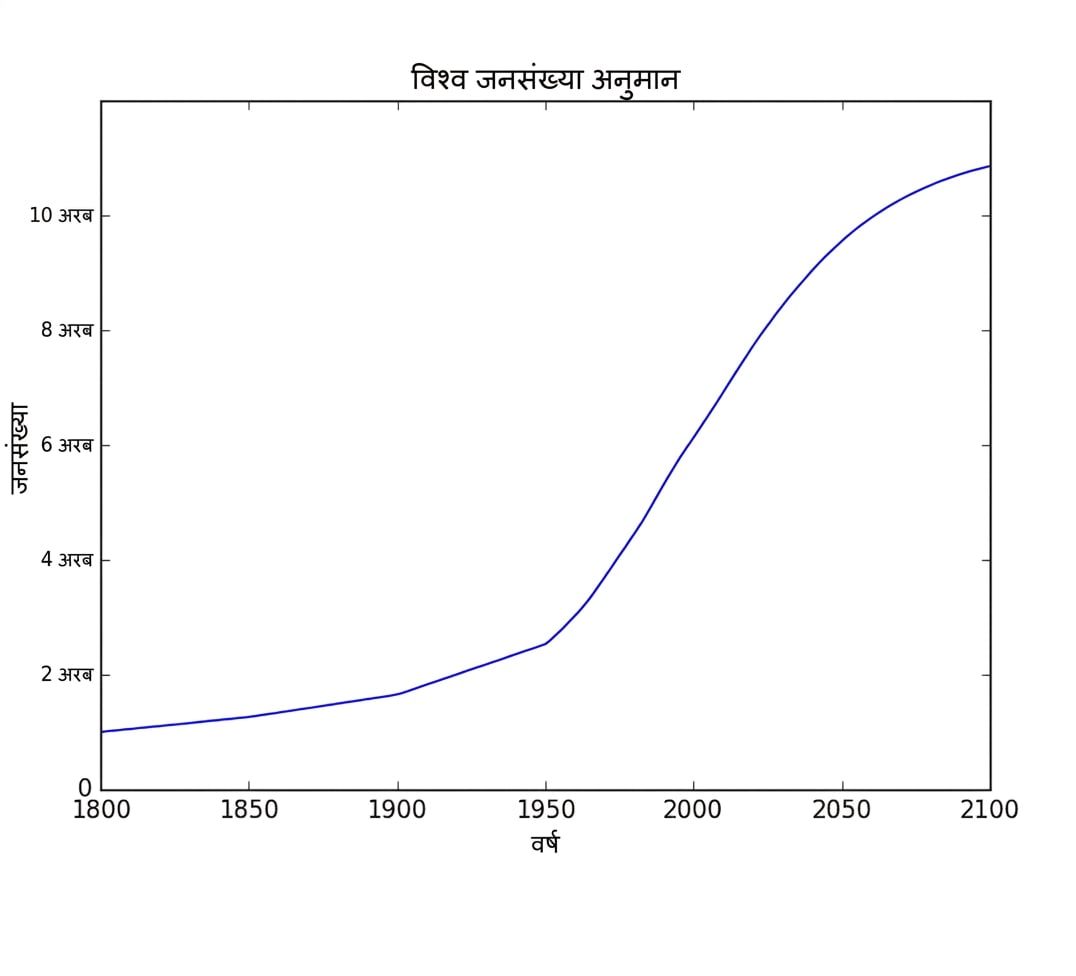
ऐतिहासिक डेटा जोड़ें

population.py

import matplotlib.pyplot as plt
year = [1950, 1951, 1952, ..., 2100] 
pop = [2.538, 2.57, 2.62, ..., 10.85]

# Add more data year = [1800, 1850, 1900] + year pop = [1.0, 1.262, 1.650] + pop
plt.plot(year, pop)
plt.xlabel('Year') plt.ylabel('Population')
plt.title('World Population Projections')
plt.yticks([0, 2, 4, 6, 8, 10],
['0', '2B', '4B', '6B', '8B', '10B'])
plt.show()

ch1_3_slides.028.png

इंटरमीडिएट Python

ऐतिहासिक डेटा जोड़ें

population.py

import matplotlib.pyplot as plt
year = [1950, 1951, 1952, ..., 2100] 
pop = [2.538, 2.57, 2.62, ..., 10.85]

# Add more data year = [1800, 1850, 1900] + year pop = [1.0, 1.262, 1.650] + pop
plt.plot(year, pop)
plt.xlabel('Year') plt.ylabel('Population')
plt.title('World Population Projections')
plt.yticks([0, 2, 4, 6, 8, 10],
['0', '2B', '4B', '6B', '8B', '10B'])
plt.show()

ch1_3_slides.030.png

इंटरमीडिएट Python

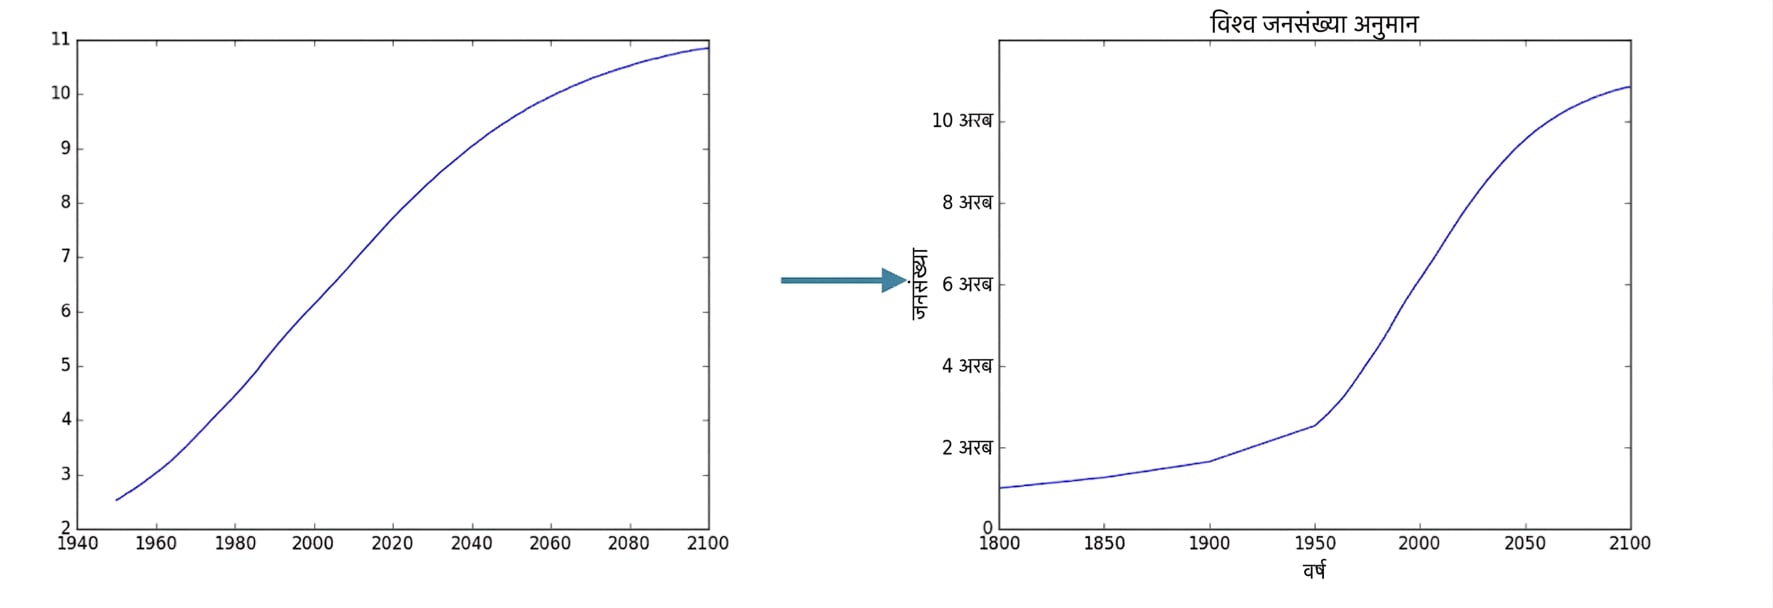
पहले बनाम बाद में

ch1_3_slides.031.png

इंटरमीडिएट Python

अभ्यास करते हैं!

इंटरमीडिएट Python

Preparing Video For Download...