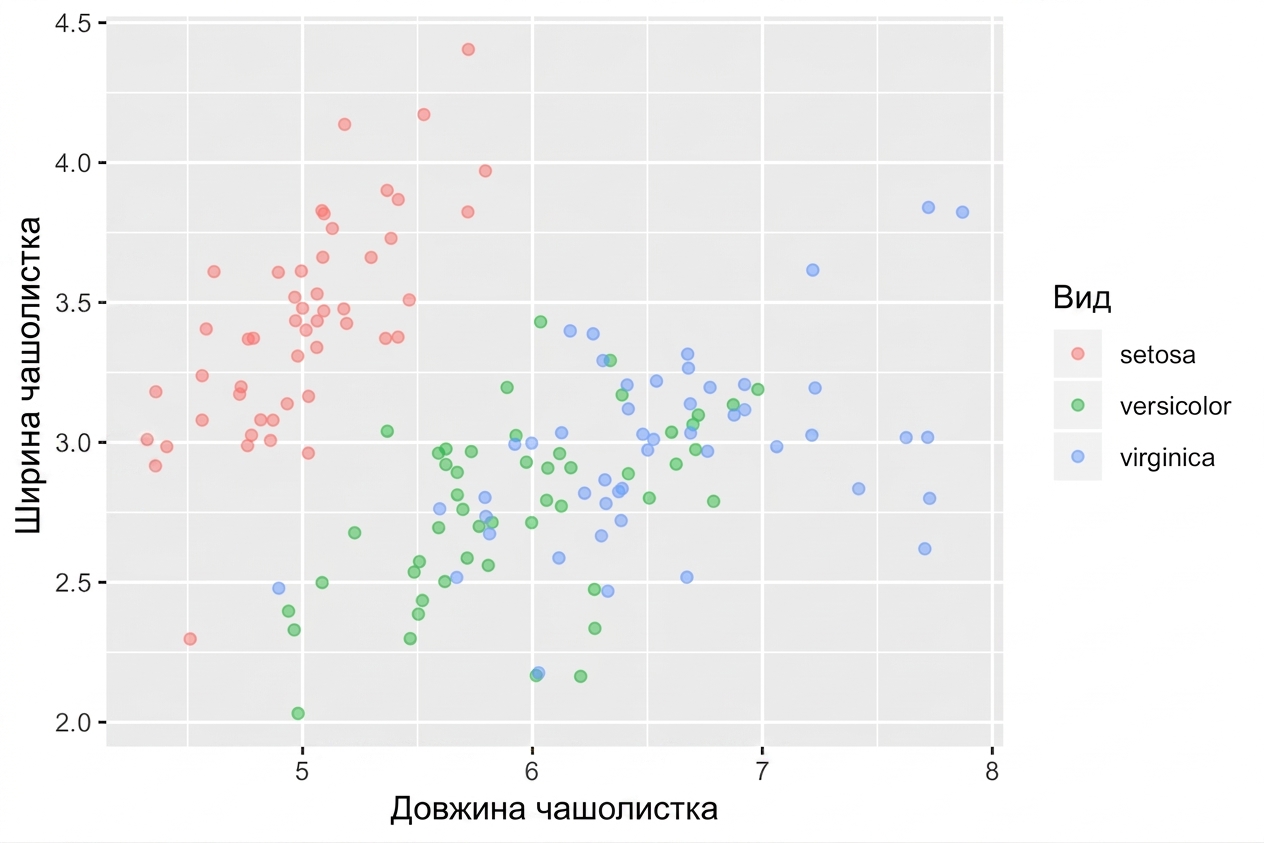
Найкращі практики естетики
Вступ до візуалізації даних з ggplot2

Rick Scavetta
Founder, Scavetta Academy
Форма підпорядковується функції
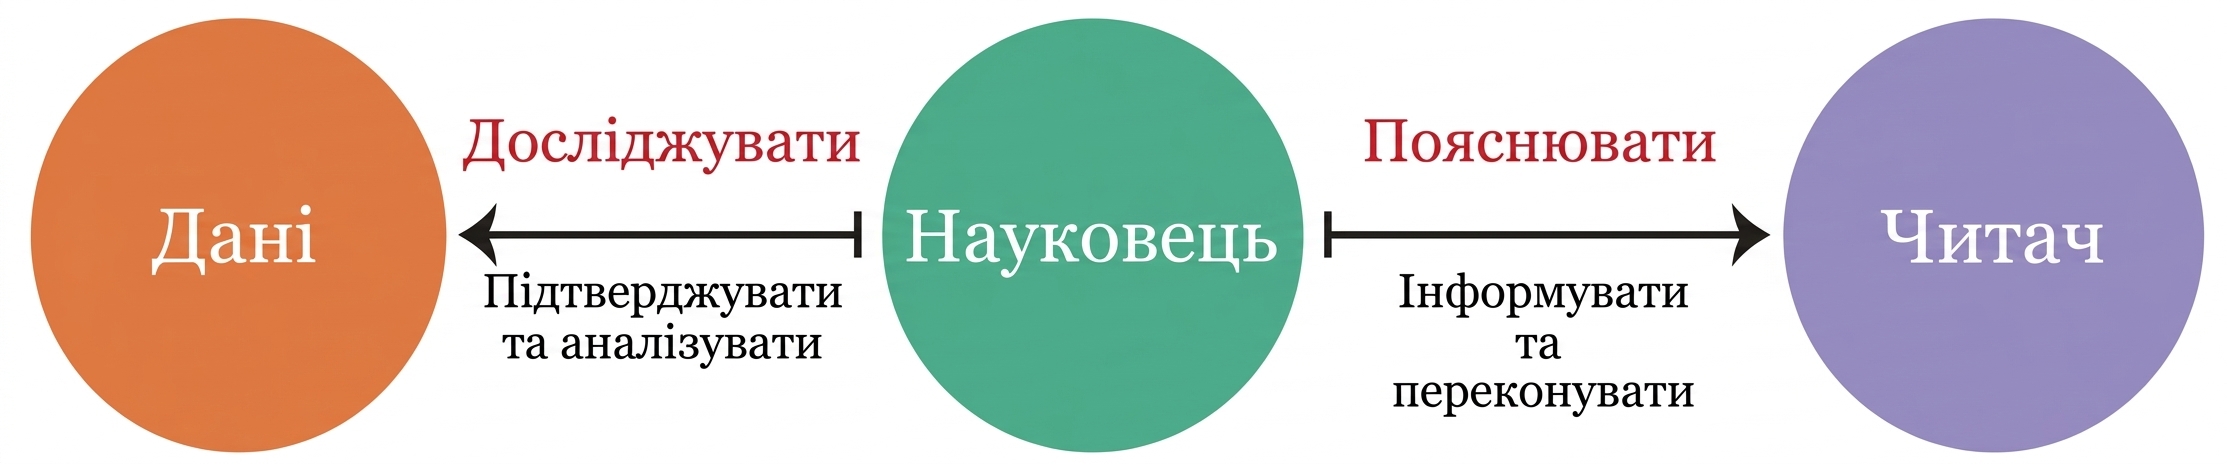
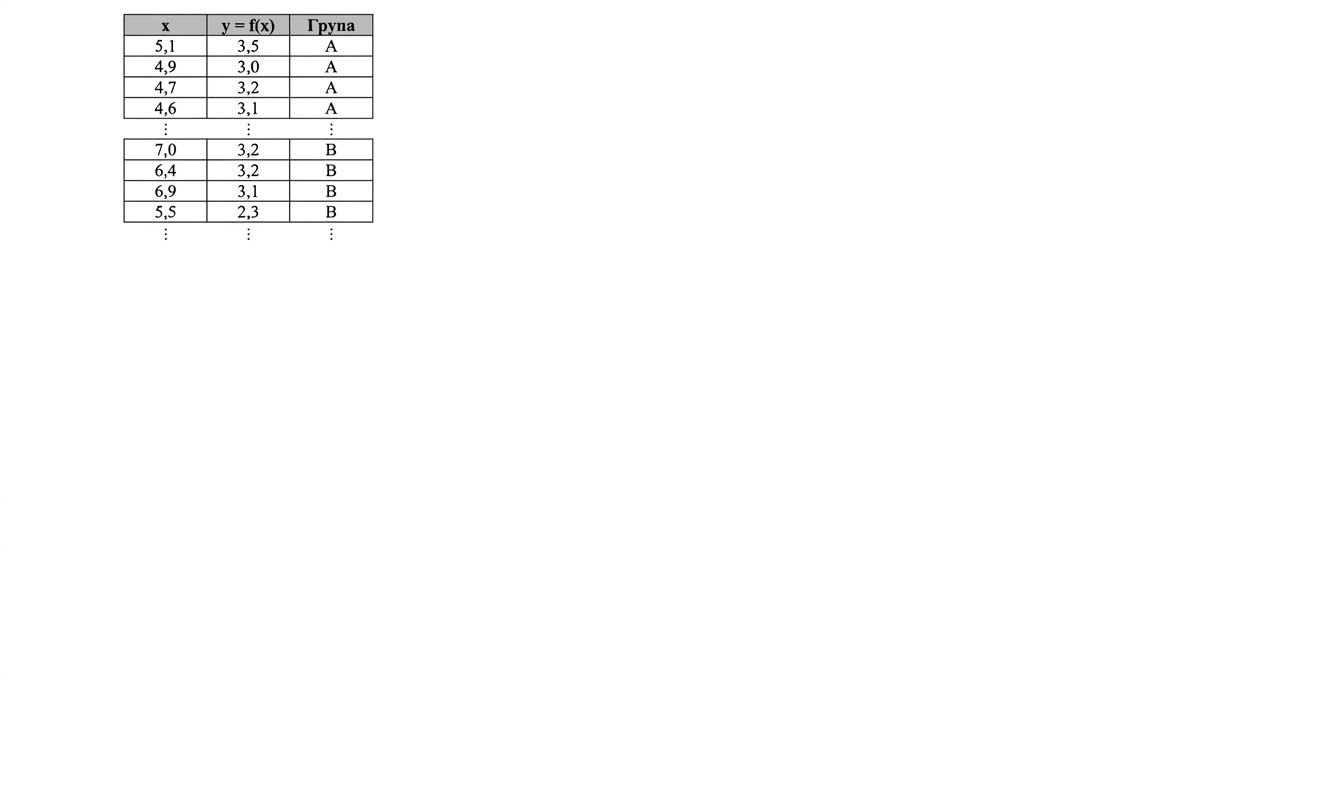
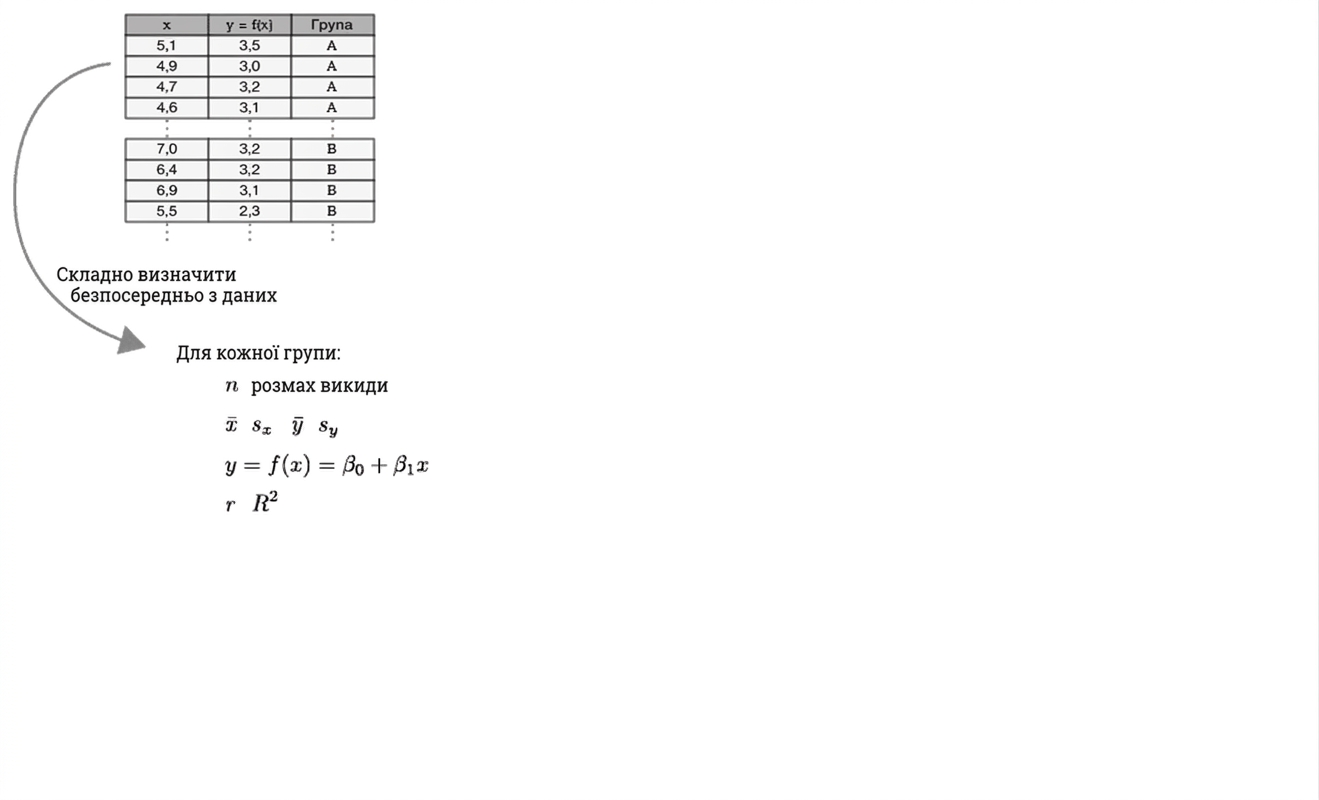
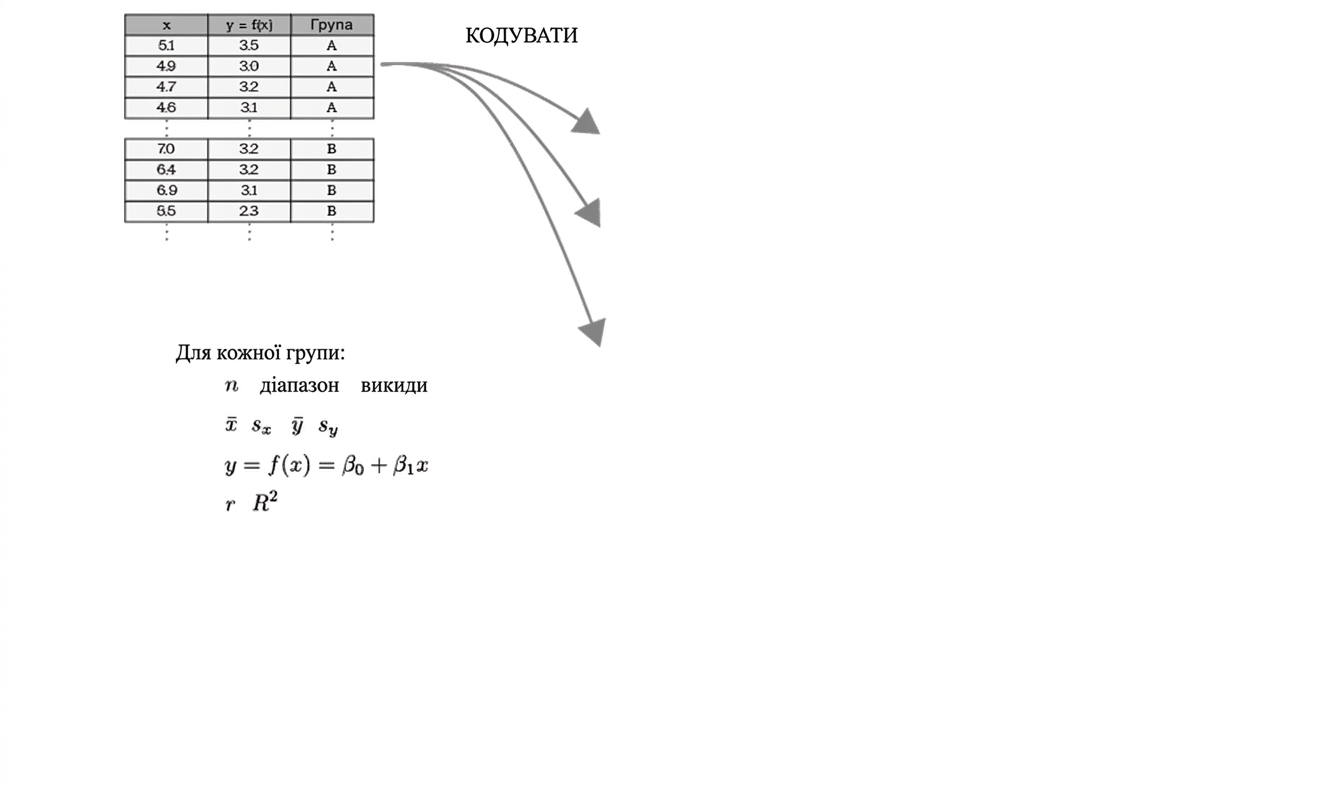
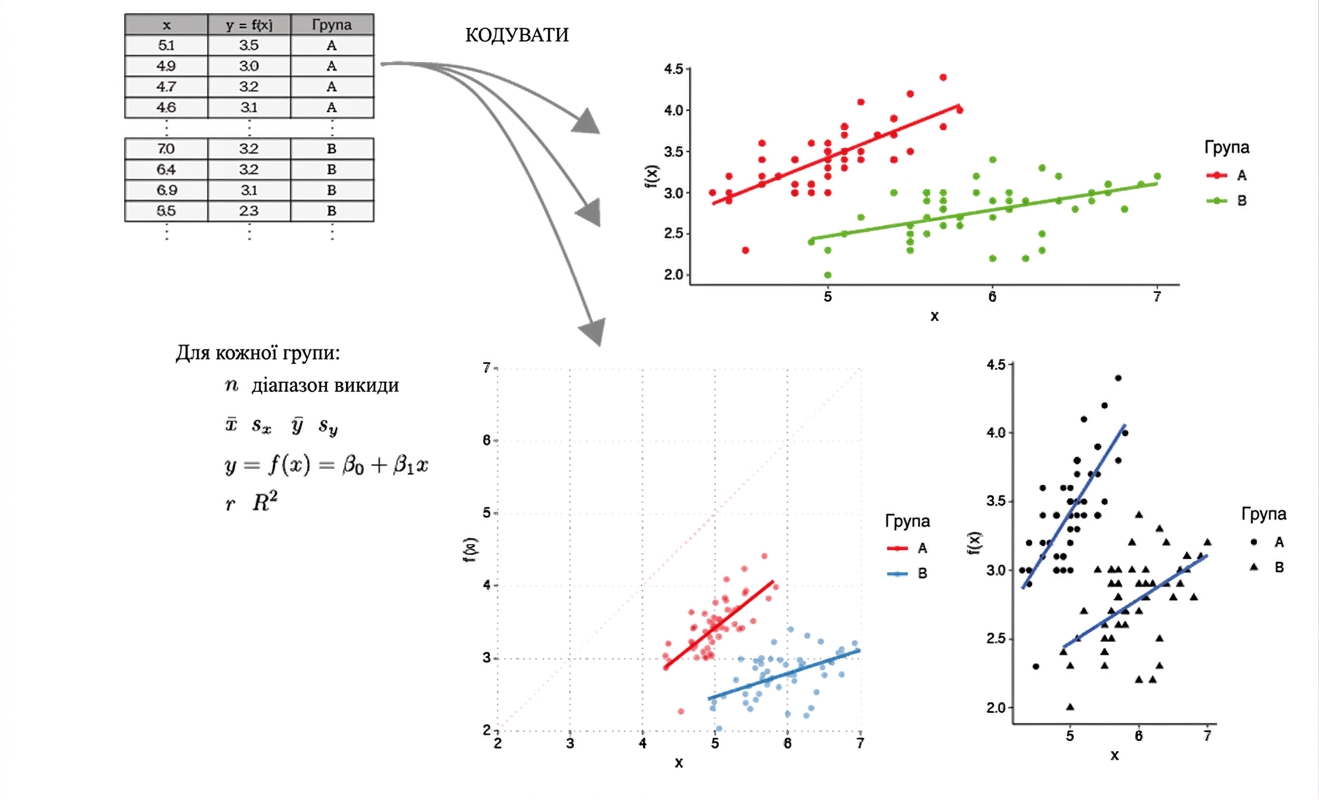
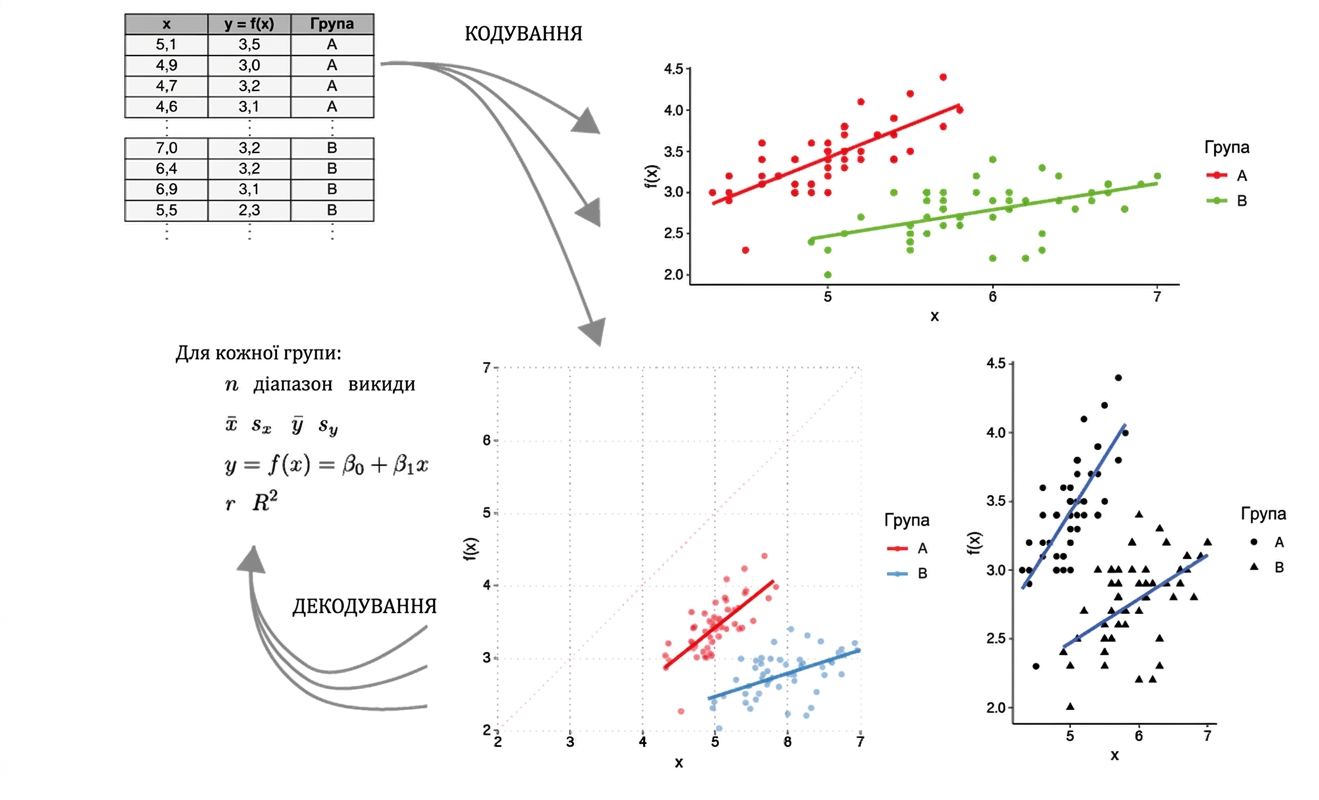
Видобування інформації з даних

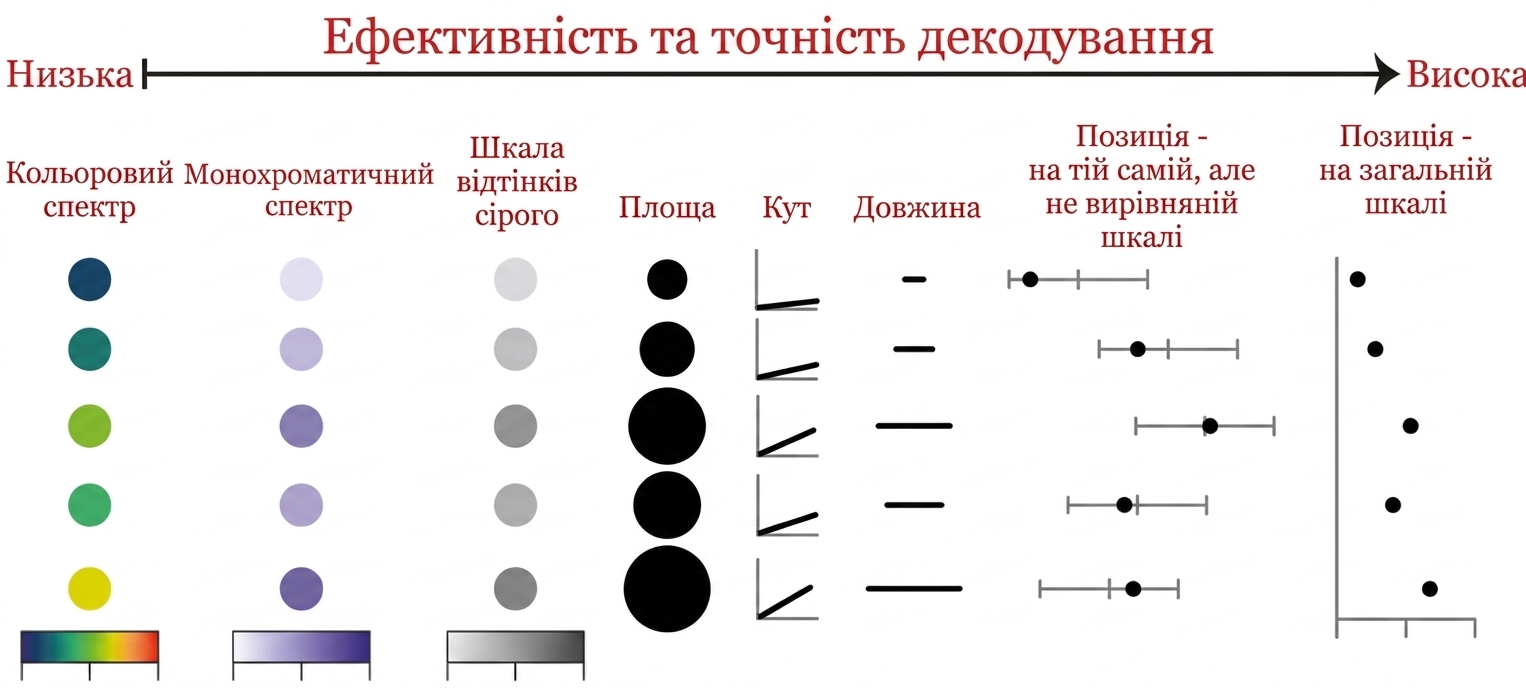
Естетики — неперервні змінні
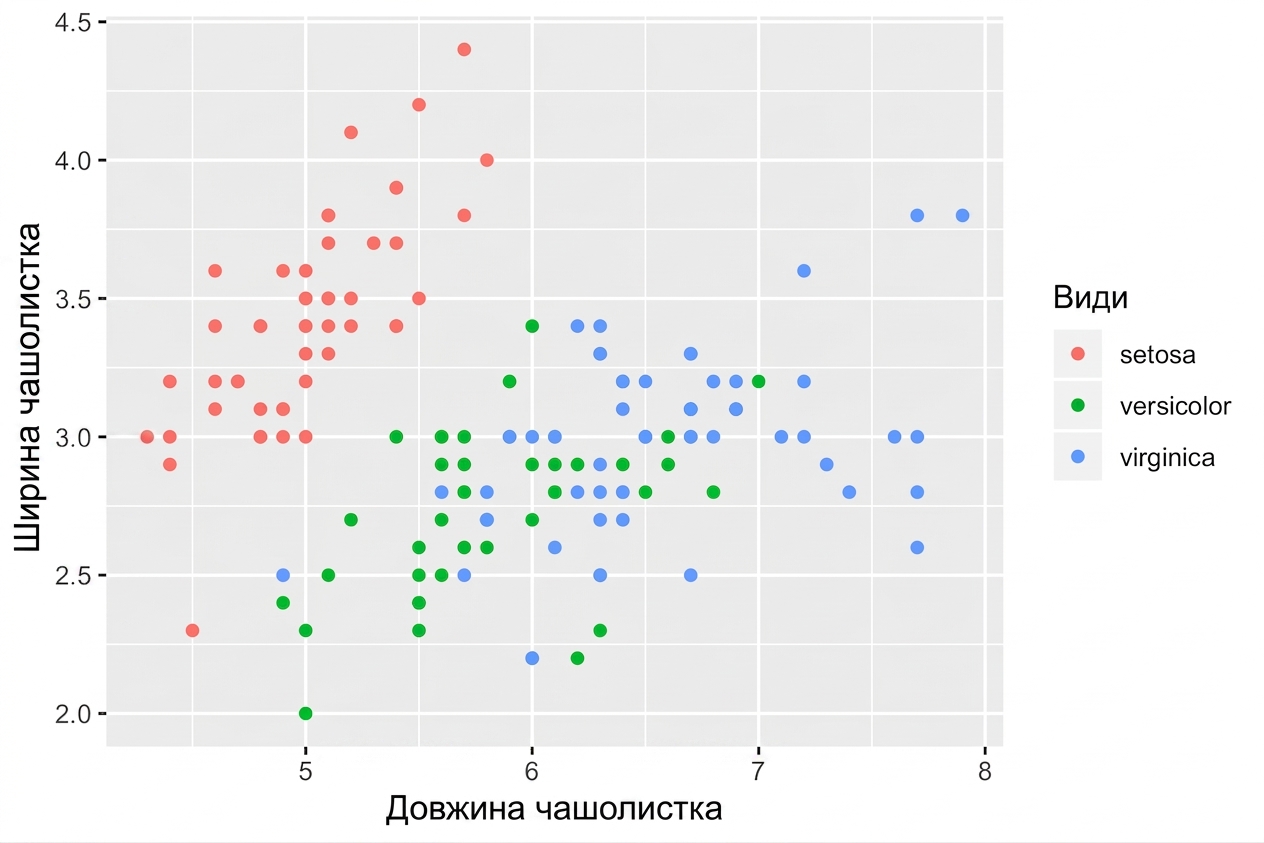
Естетики — неперервні змінні
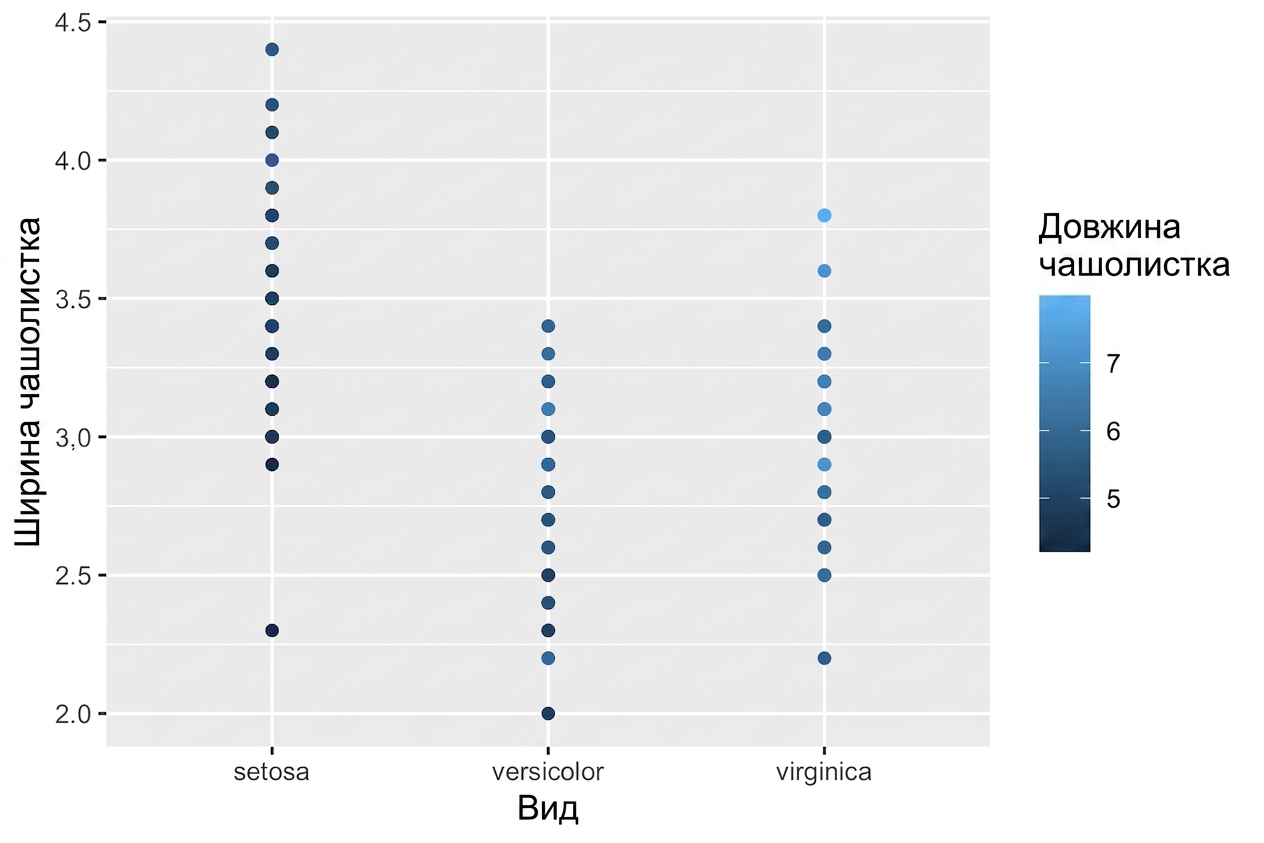
Три діаграми розсіювання iris
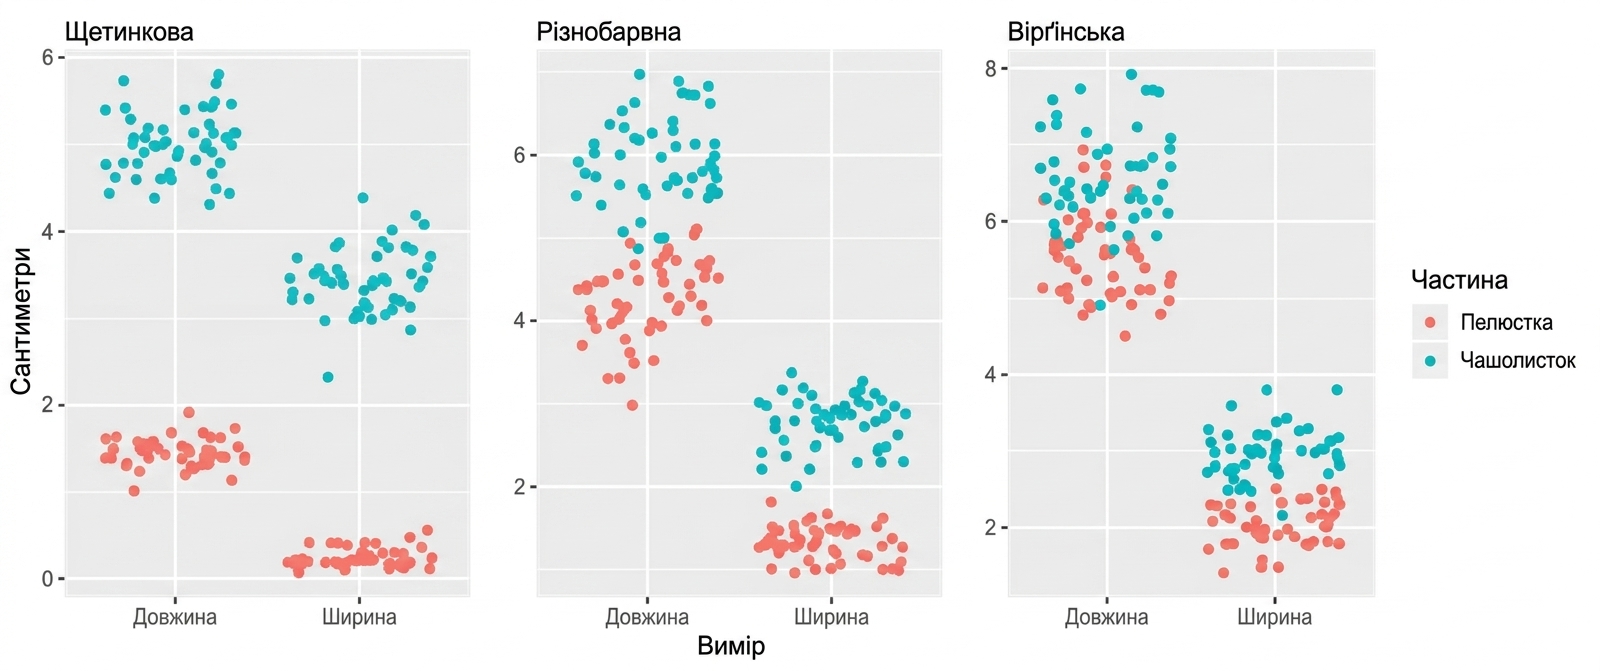
Три діаграми розсіювання iris, неузгоджені осі y
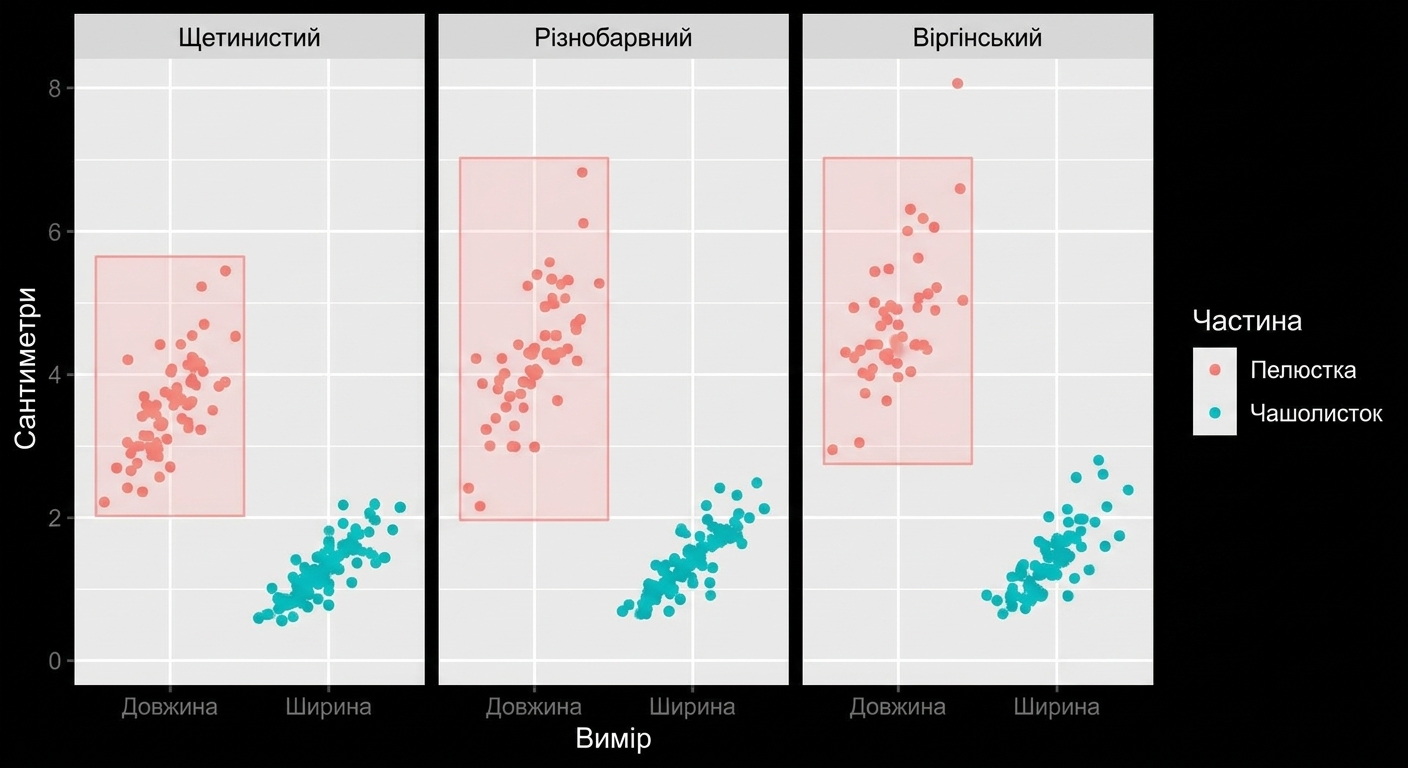
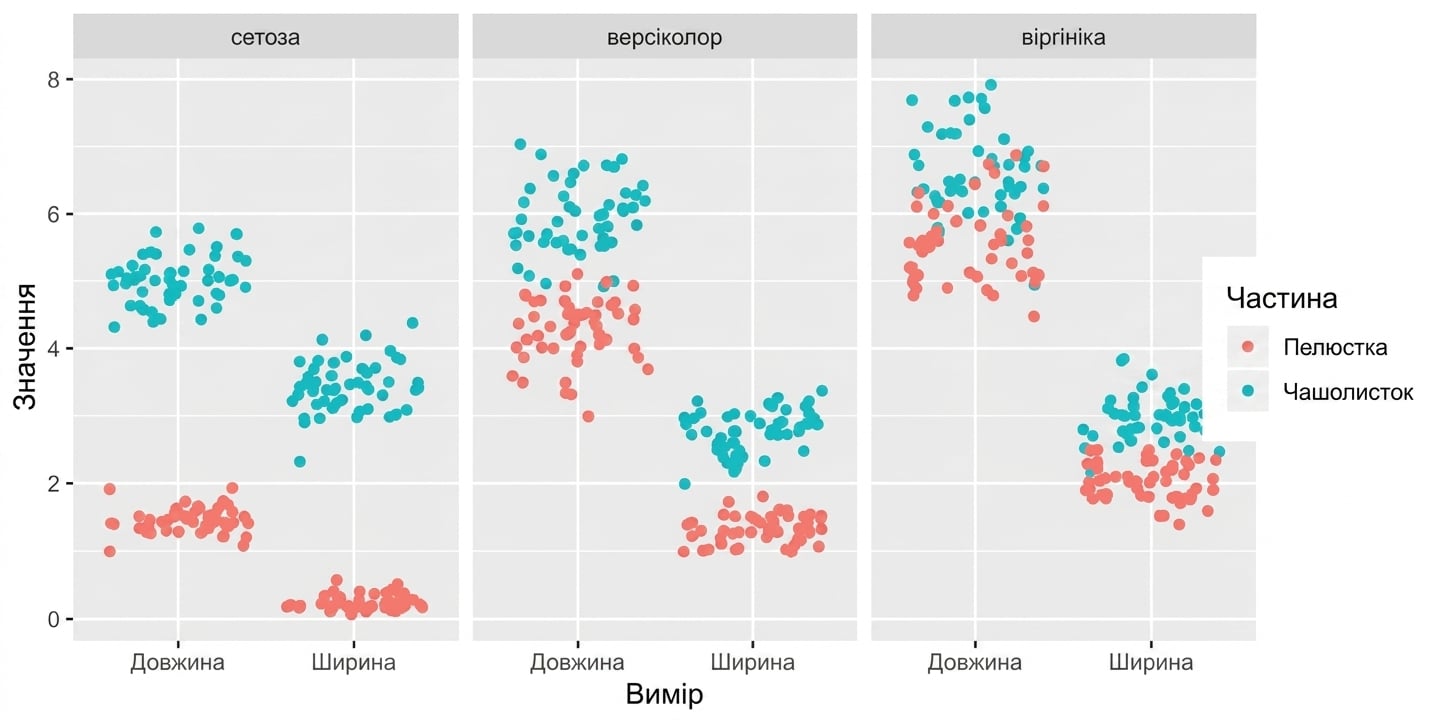
Один фасетний графік, спільна вісь y
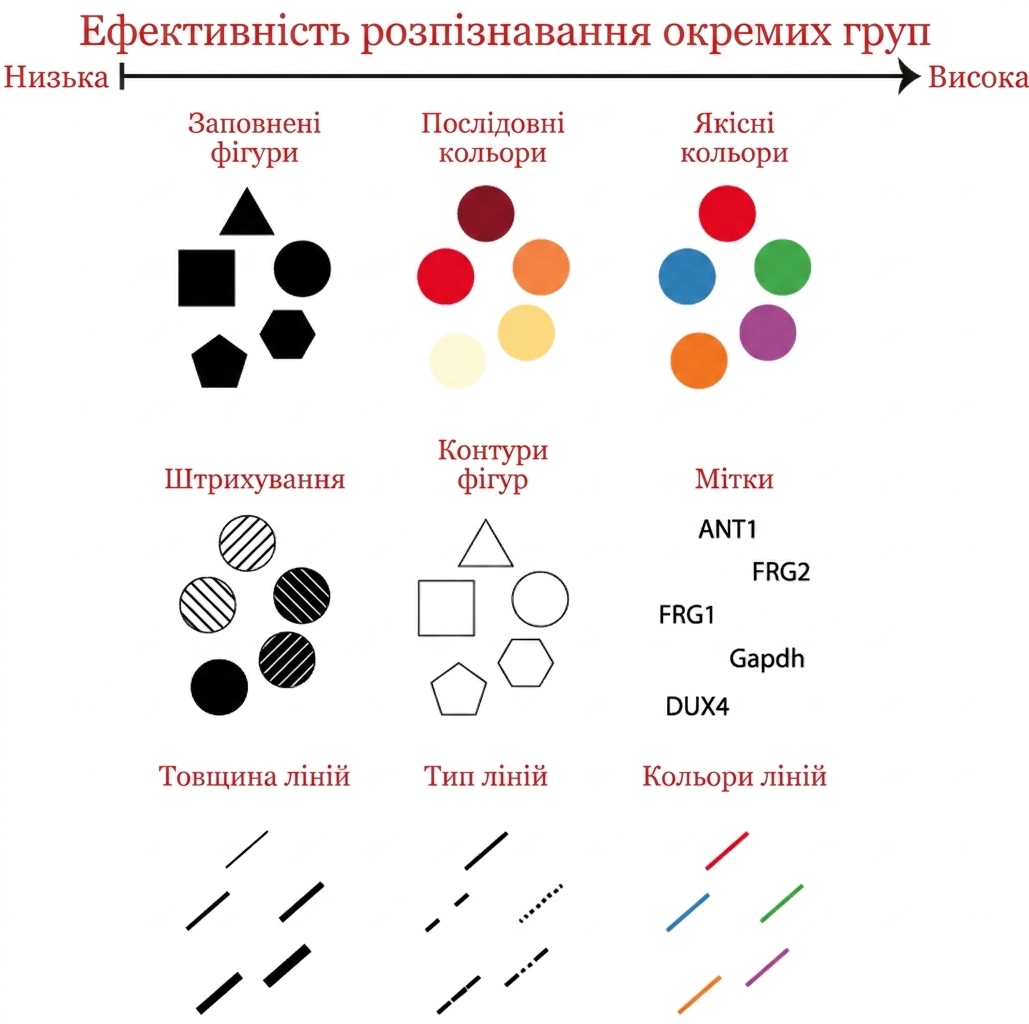
Естетики — категорійні змінні
Естетики — категорійні змінні