लाइन प्लॉट्स

ggplot2 के साथ डेटा विज़ुअलाइज़ेशन परिचय

Rick Scavetta

Founder, Scavetta Academy

आम प्लॉट प्रकार

प्लॉट प्रकार संभव Geoms
स्कैटर प्लॉट्स points, jitter, abline, smooth, count
बार प्लॉट्स histogram, bar, col, errorbar
लाइन प्लॉट्स line, path
ggplot2 के साथ डेटा विज़ुअलाइज़ेशन परिचय

बीवर

str(beaver)
'data.frame':    101 obs. of  3 variables:
 $ time  : POSIXct, format: "2000-01-01 09:30:00" "2000-01-01 09:40:00" "2000-01-01 09:50:00" ...
 $ temp  : num  36.6 36.7 36.9 37.1 37.2 ...
 $ active: Factor w/ 2 levels "0","1": 1 1 1 1 1 1 1 1 1 1 ...
ggplot2 के साथ डेटा विज़ुअलाइज़ेशन परिचय

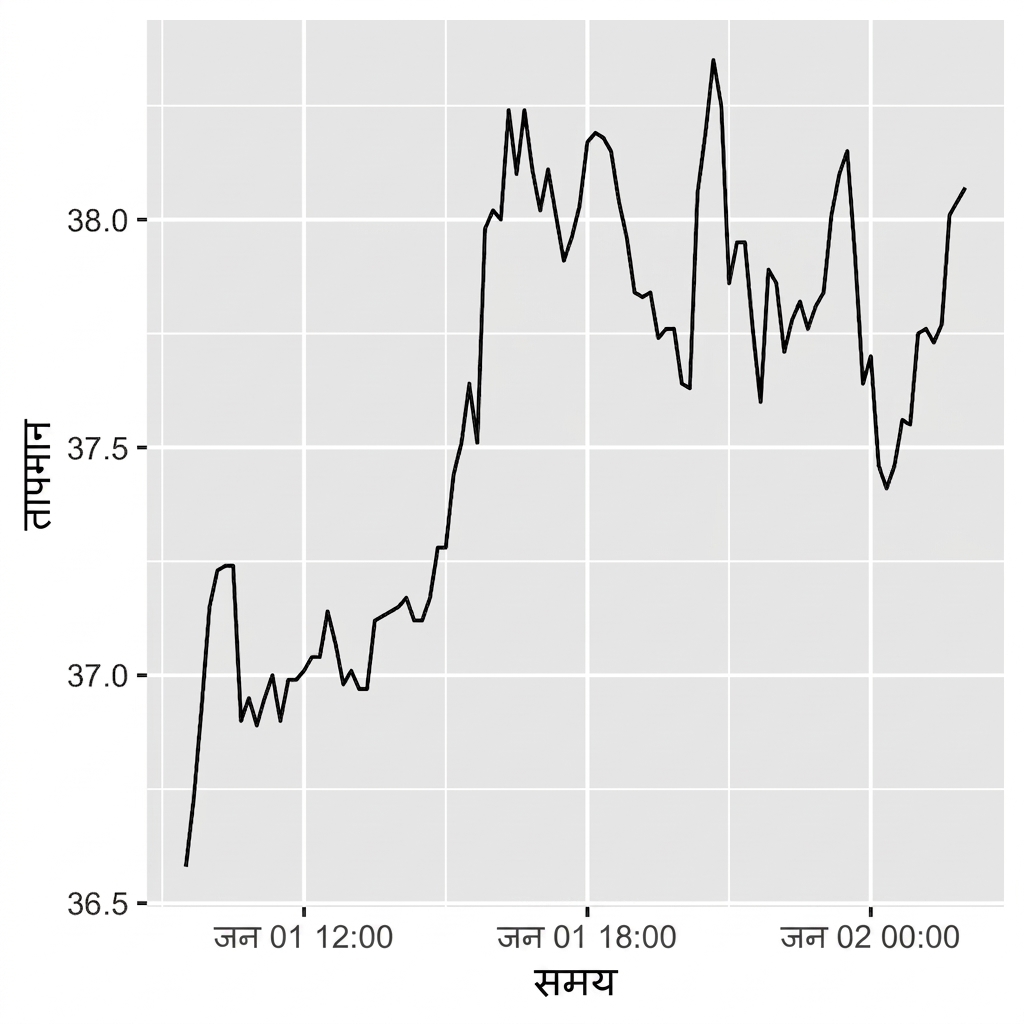
बीवर

ggplot(beaver, aes(x = time, y = temp)) +
  geom_line()

ggplot2 के साथ डेटा विज़ुअलाइज़ेशन परिचय

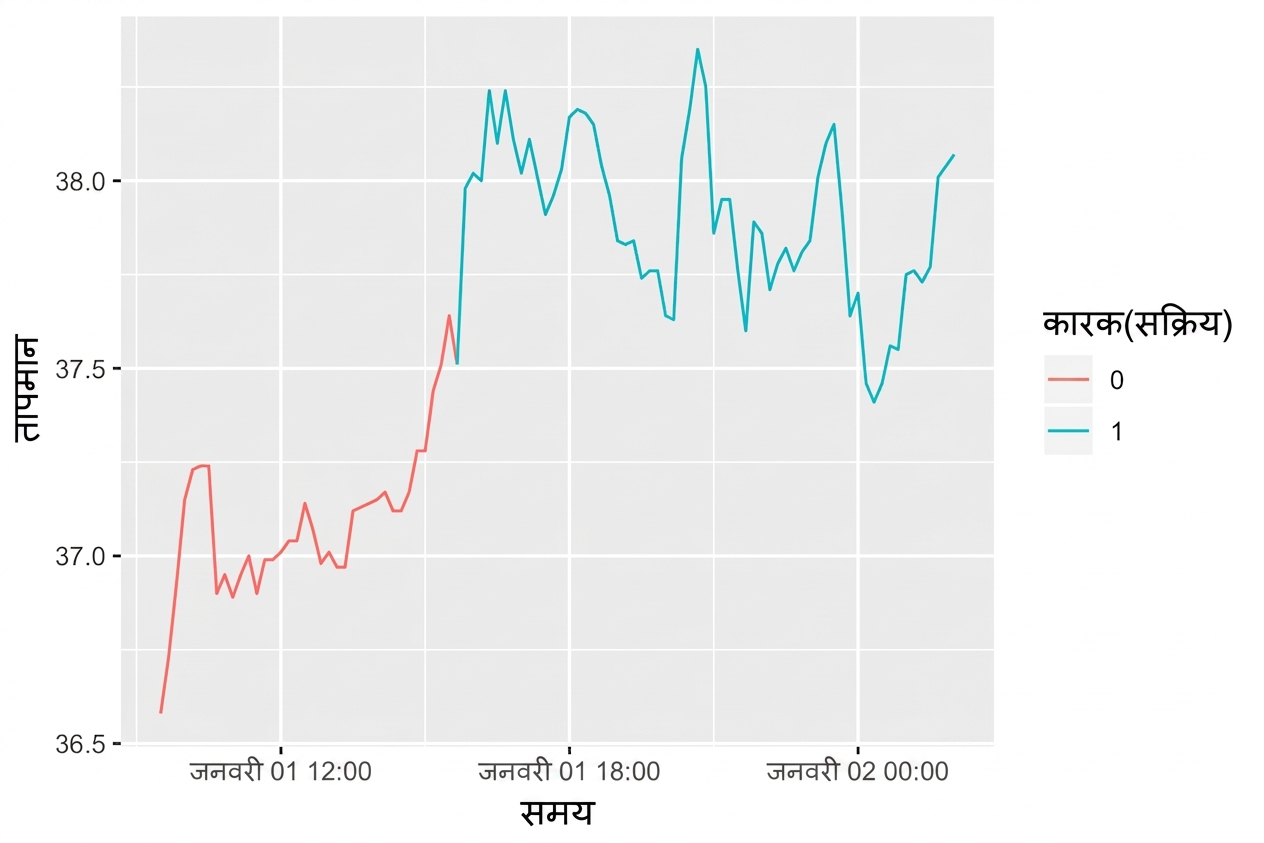
बीवर

ggplot(beaver, aes(x = time, y = temp, 
                   color = factor(active))
                   ) +
  geom_line()

ggplot2 के साथ डेटा विज़ुअलाइज़ेशन परिचय

फिश कैच डेटासेट

str(fish)
'data.frame':    427 obs. of  3 variables:
 $ Species: Factor w/ 7 levels "Pink","Chum",..: 1 2 3 4 5 6 7 1 2 3 ...
 $ Year   : int  1950 1950 1950 1950 1950 1950 1950 1951 1951 1951 ...
 $ Capture: int  100600 139300 64100 30500 0 23200 10800 259000 155900 51200 ...
ggplot2 के साथ डेटा विज़ुअलाइज़ेशन परिचय

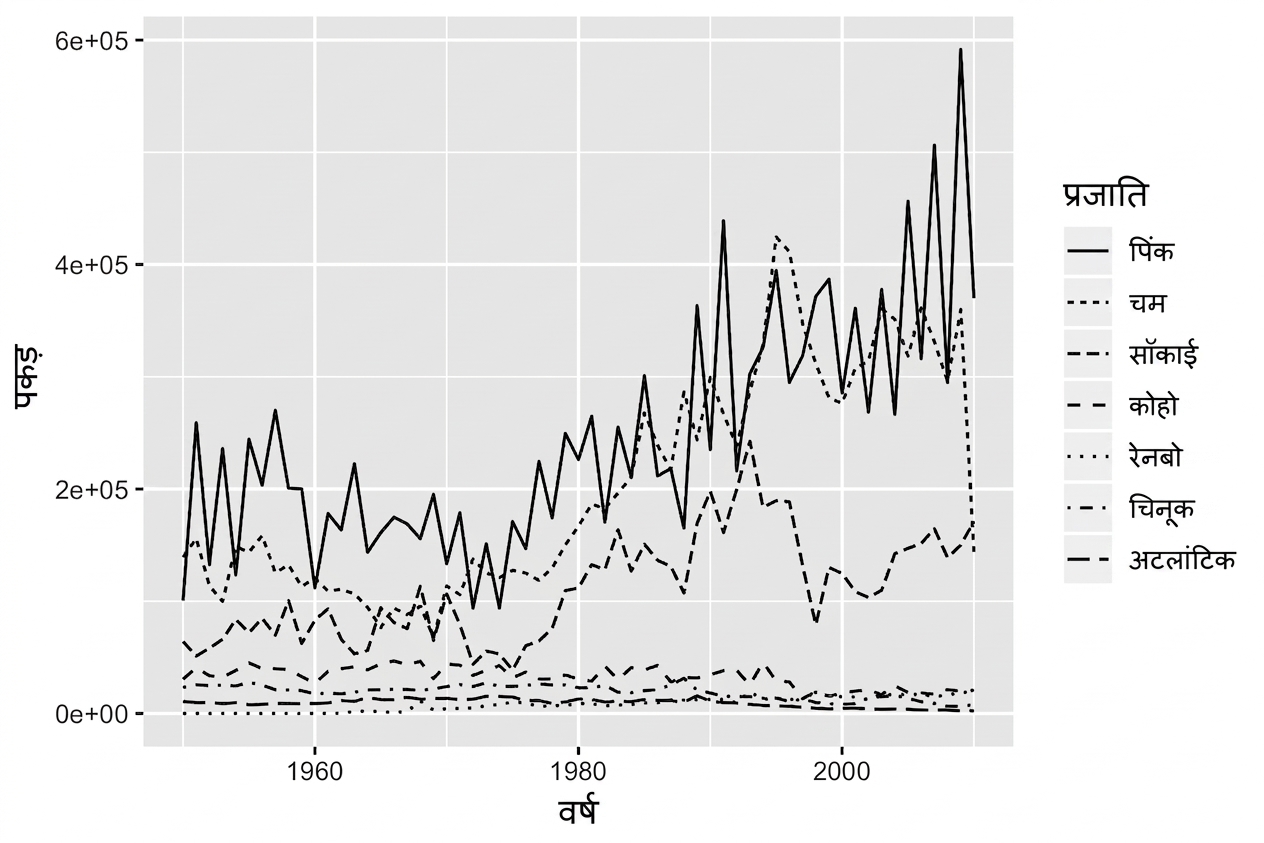
Linetype एस्थेटिक

ggplot(fish, aes(x = Year, 
                 y = Capture, 
                 linetype = Species)) + 
  geom_line()

ggplot2 के साथ डेटा विज़ुअलाइज़ेशन परिचय

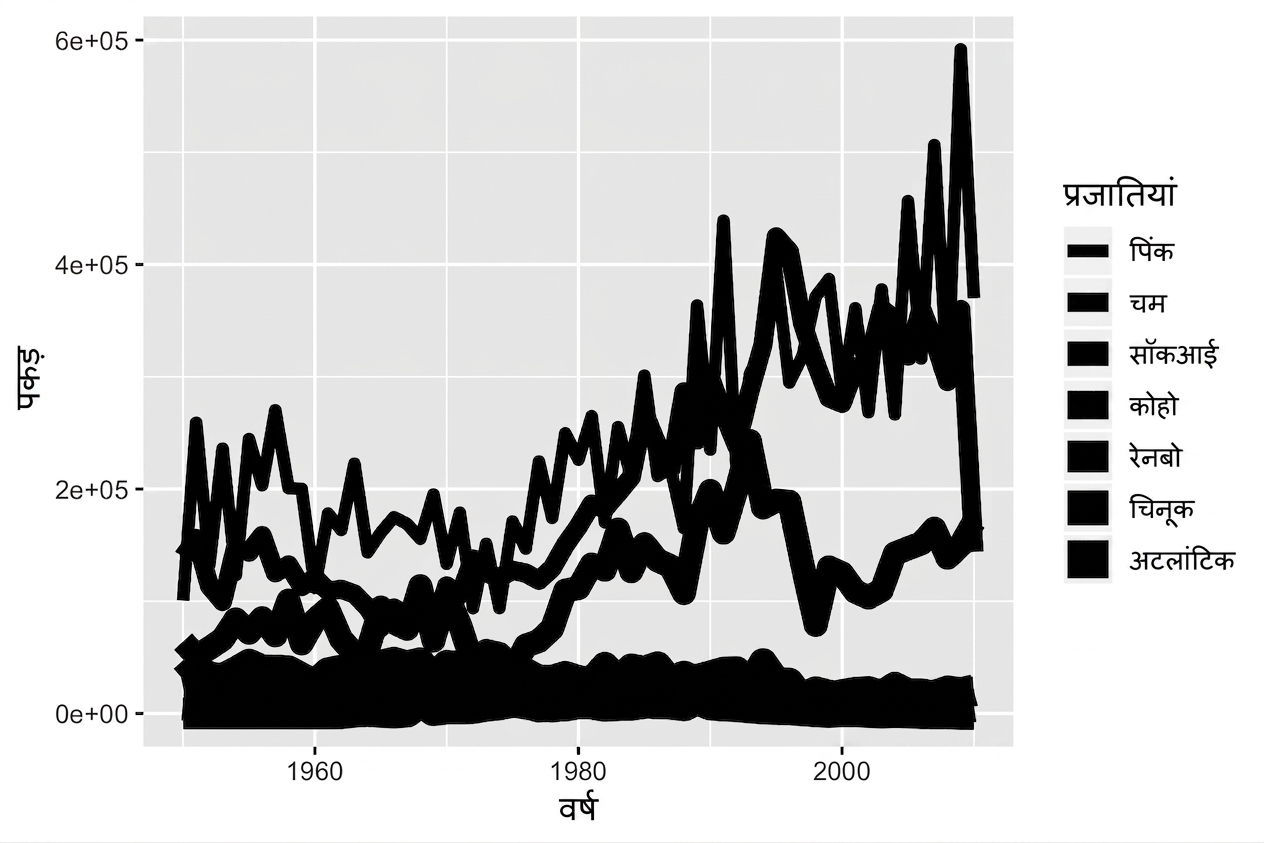
Size एस्थेटिक

ggplot(fish, aes(x = Year, 
                 y = Capture, 
                 size = Species)) + 
  geom_line()

ggplot2 के साथ डेटा विज़ुअलाइज़ेशन परिचय

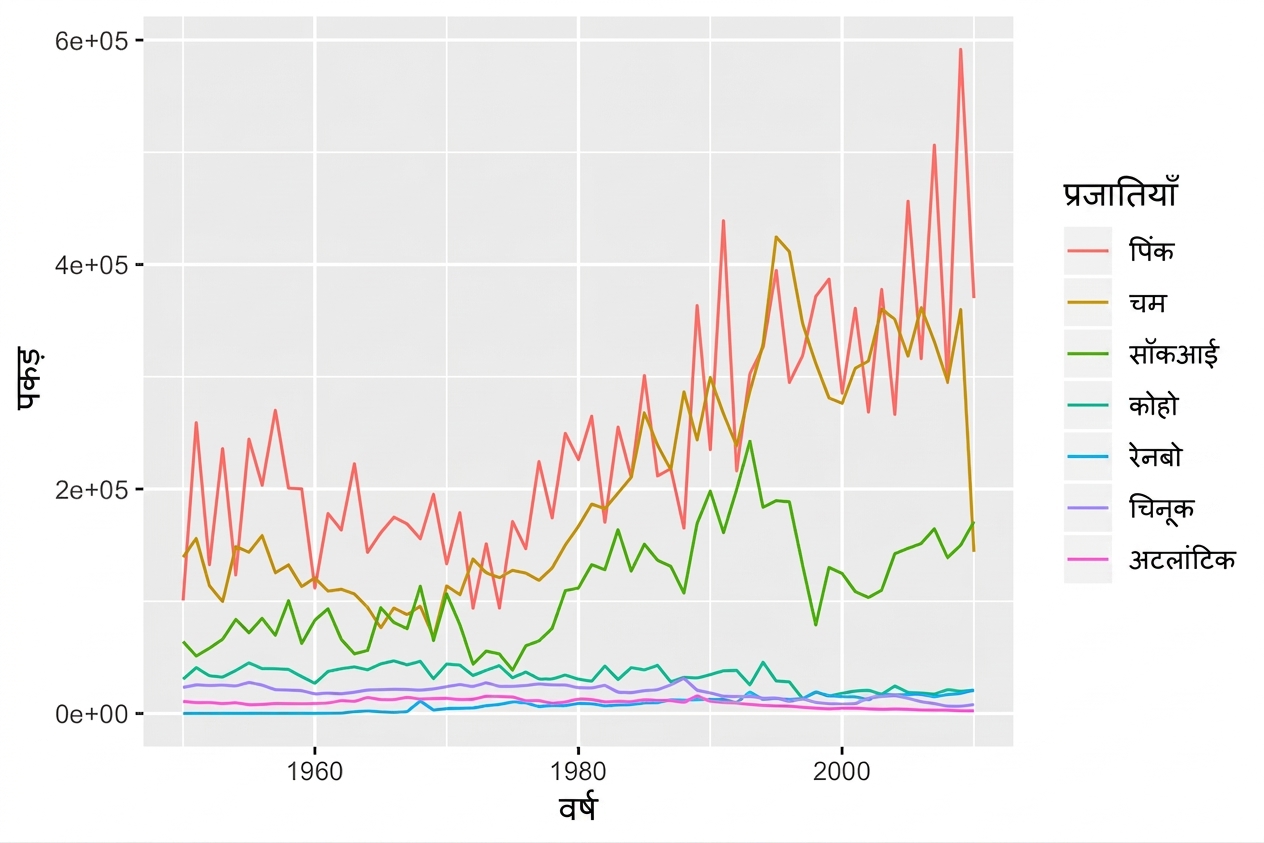
Color एस्थेटिक

ggplot(fish, aes(x = Year, 
                 y = Capture, 
                 color = Species)) + 
  geom_line()

ggplot2 के साथ डेटा विज़ुअलाइज़ेशन परिचय

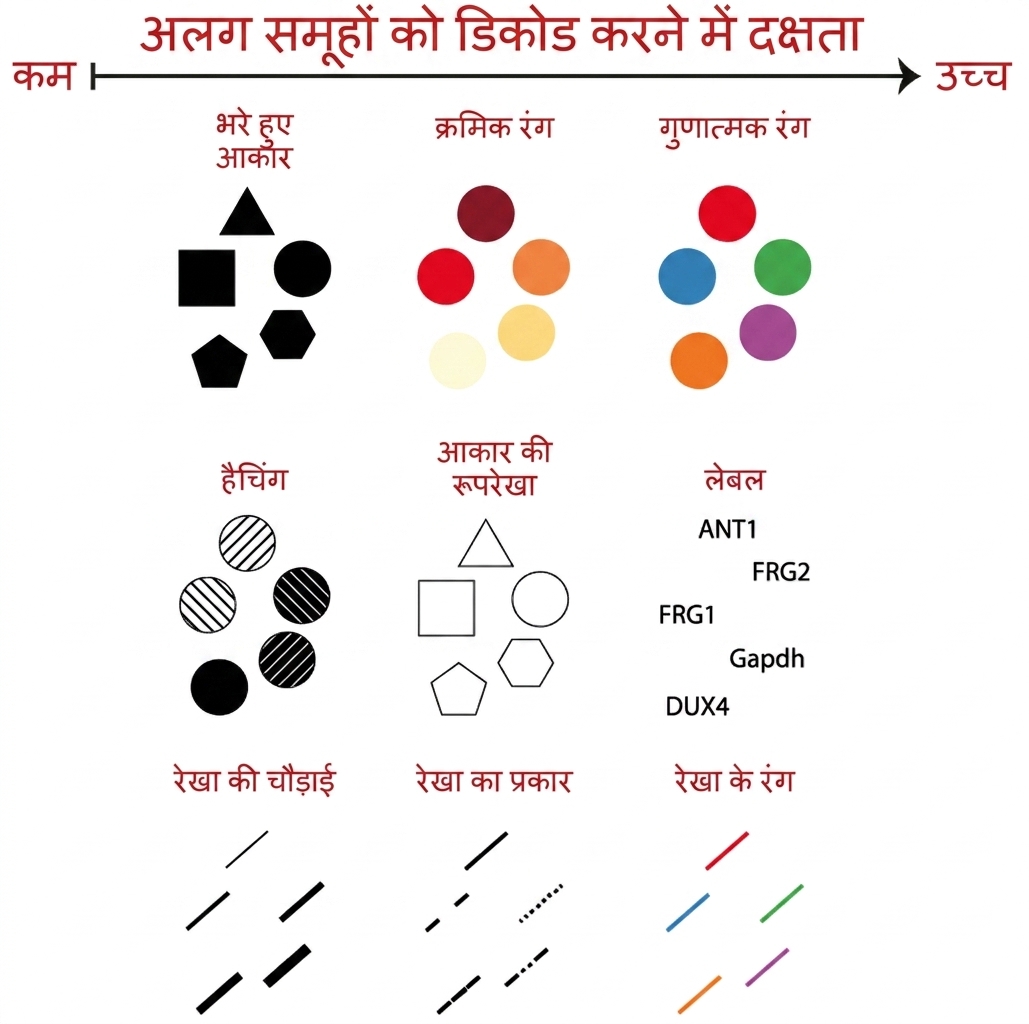
श्रेणीबद्ध वैरिएबल्स के लिए एस्थेटिक्स
ggplot2 के साथ डेटा विज़ुअलाइज़ेशन परिचय

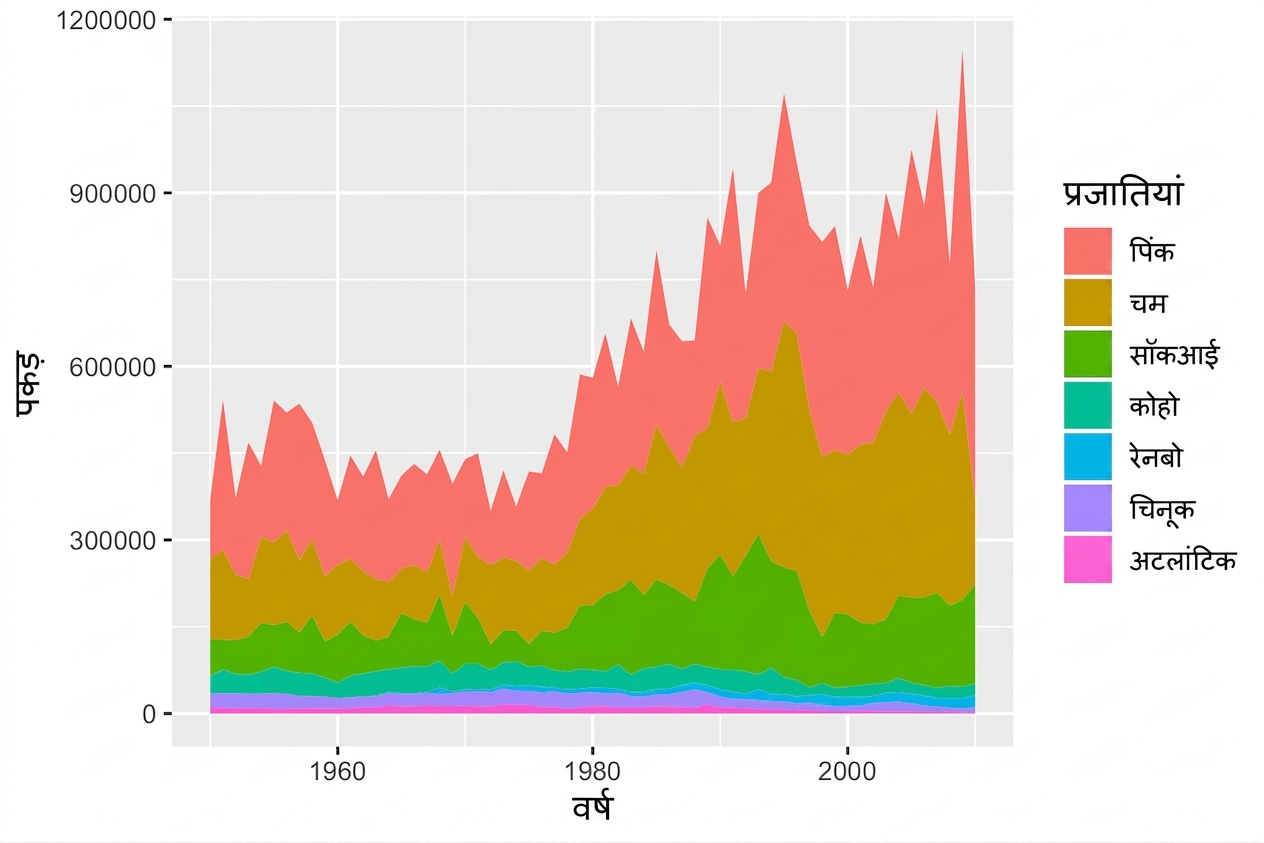
geom_area() के साथ Fill एस्थेटिक

ggplot(fish, aes(x = Year, 
                 y = Capture, 
                 fill = Species)) + 
  geom_area()

ggplot2 के साथ डेटा विज़ुअलाइज़ेशन परिचय

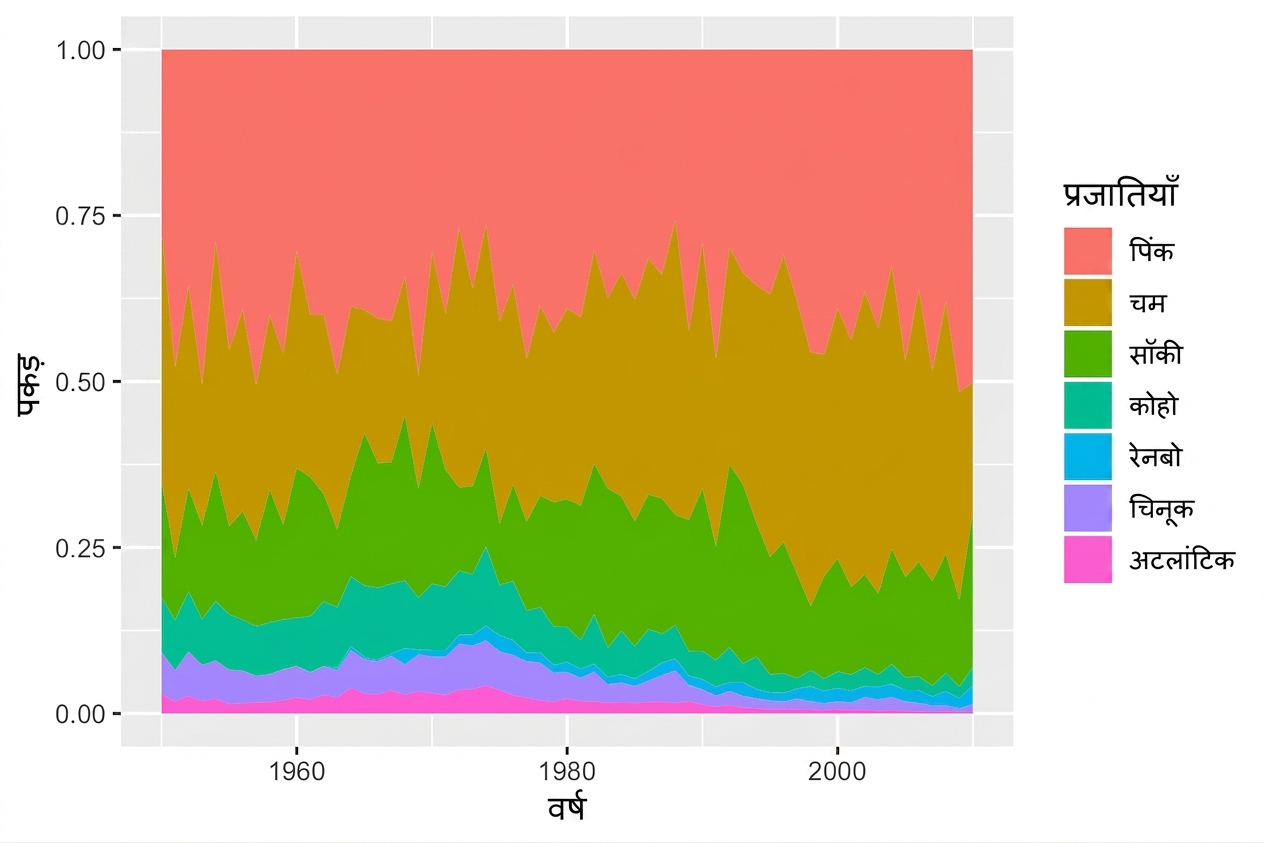
position = "fill" का उपयोग

ggplot(fish, aes(x = Year, 
                 y = Capture, 
                 fill = Species)) + 
  geom_area(position = "fill")

ggplot2 के साथ डेटा विज़ुअलाइज़ेशन परिचय

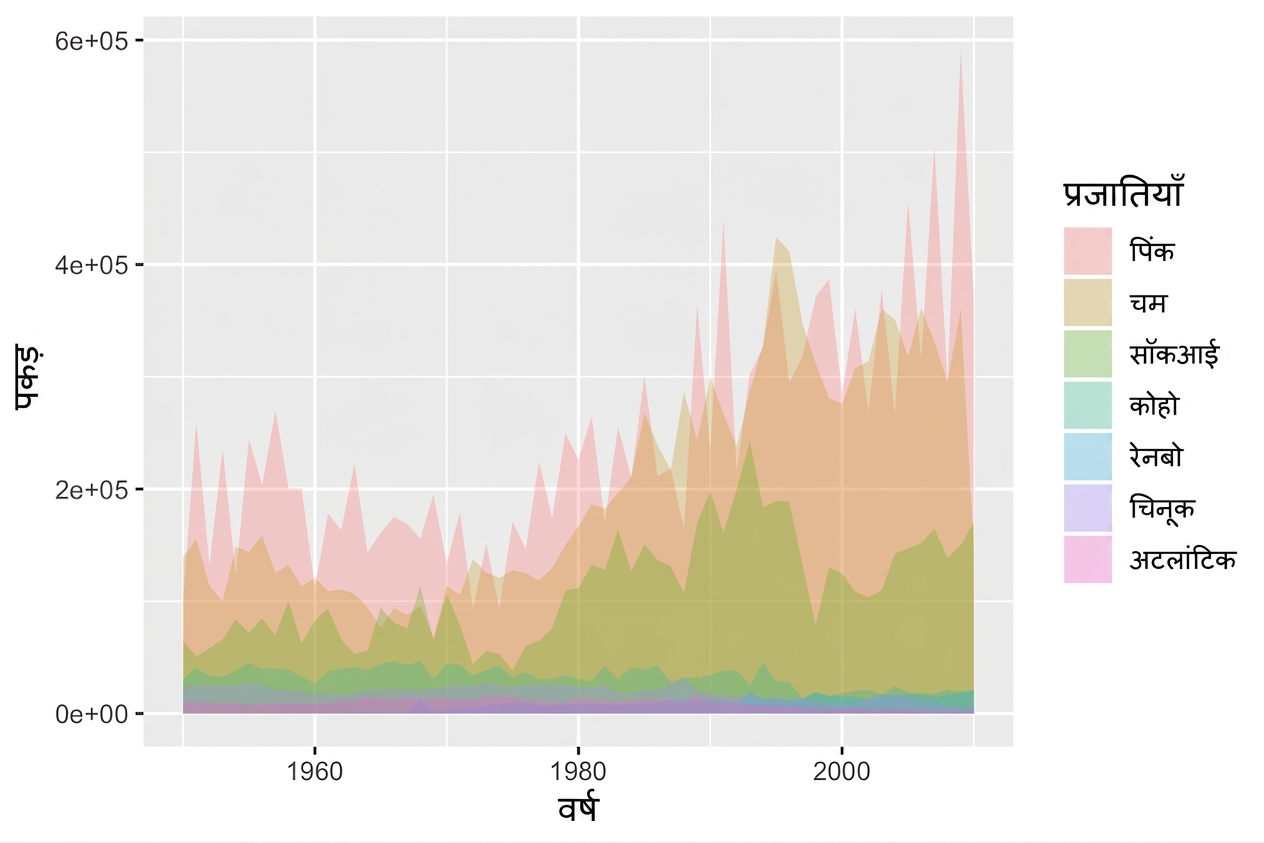
geom_ribbon()

ggplot(fish, aes(x = Year, 
                 y = Capture, 
                 fill = Species)) + 
  geom_ribbon(aes(ymax = Capture, 
                  ymin = 0), 
              alpha = 0.3)

ggplot2 के साथ डेटा विज़ुअलाइज़ेशन परिचय

अभ्यास करते हैं!

ggplot2 के साथ डेटा विज़ुअलाइज़ेशन परिचय

Preparing Video For Download...