ggplot2 के साथ डेटा विज़ुअलाइज़ेशन परिचय
Rick Scavetta
Founder, Scavetta Academy
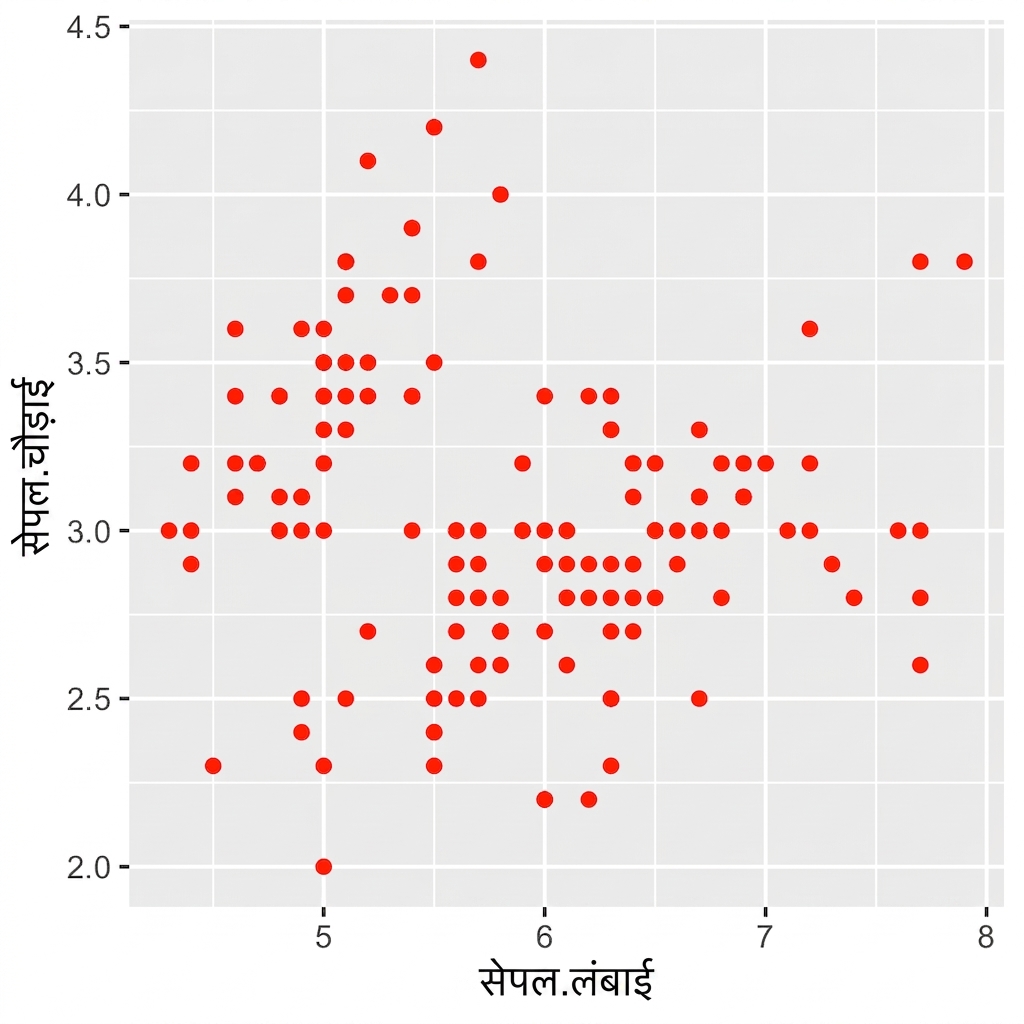
ggplot(iris, aes(x = Sepal.Length,
y = Sepal.Width)) +
geom_point(color = "red")
| Type | Property |
|---|---|
| Color | "red" |
geom_*() में attributes सेट करें।
color attribute को "red" पर set किया गया है।

ggplot(iris, aes(x = Sepal.Length,
y = Sepal.Width)) +
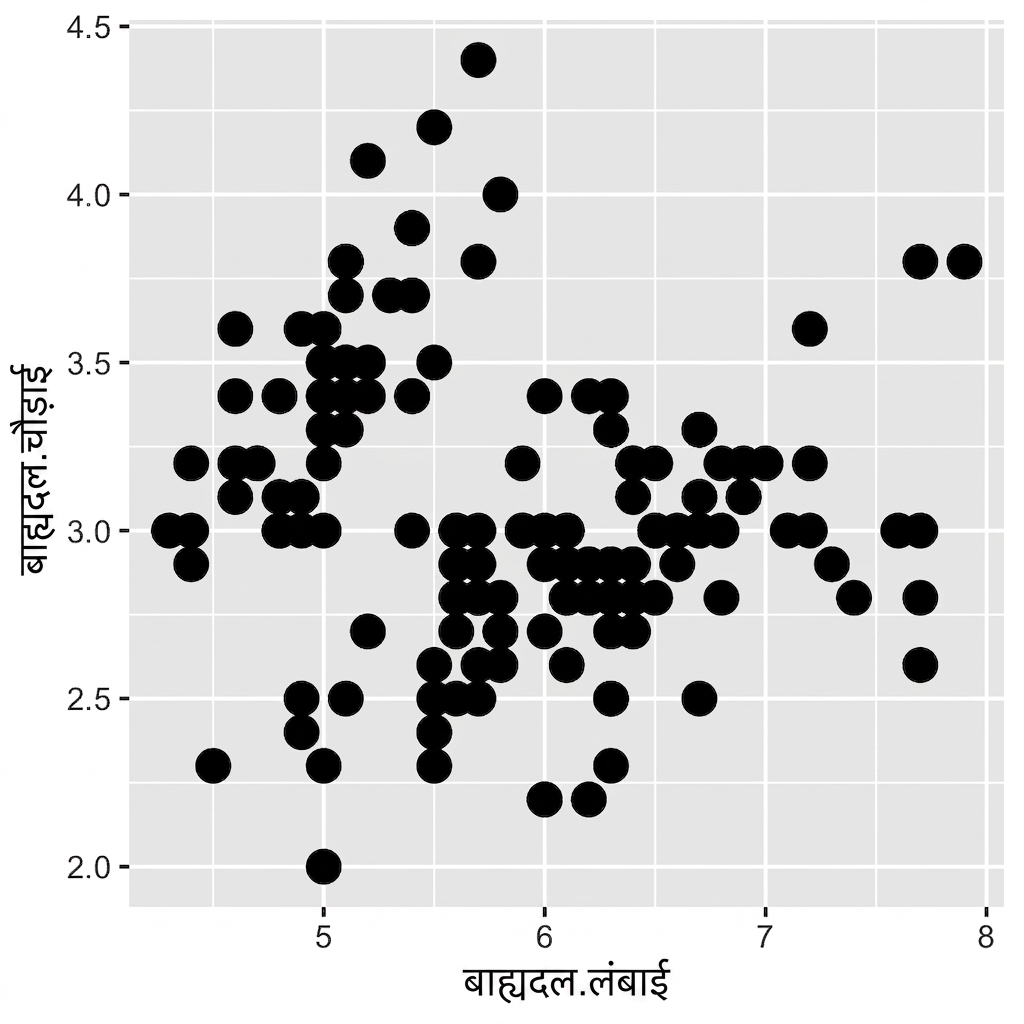
geom_point(size = 10)
| Type | Property |
|---|---|
| Size | 4 |

ggplot(iris, aes(x = Sepal.Length,
y = Sepal.Width)) +
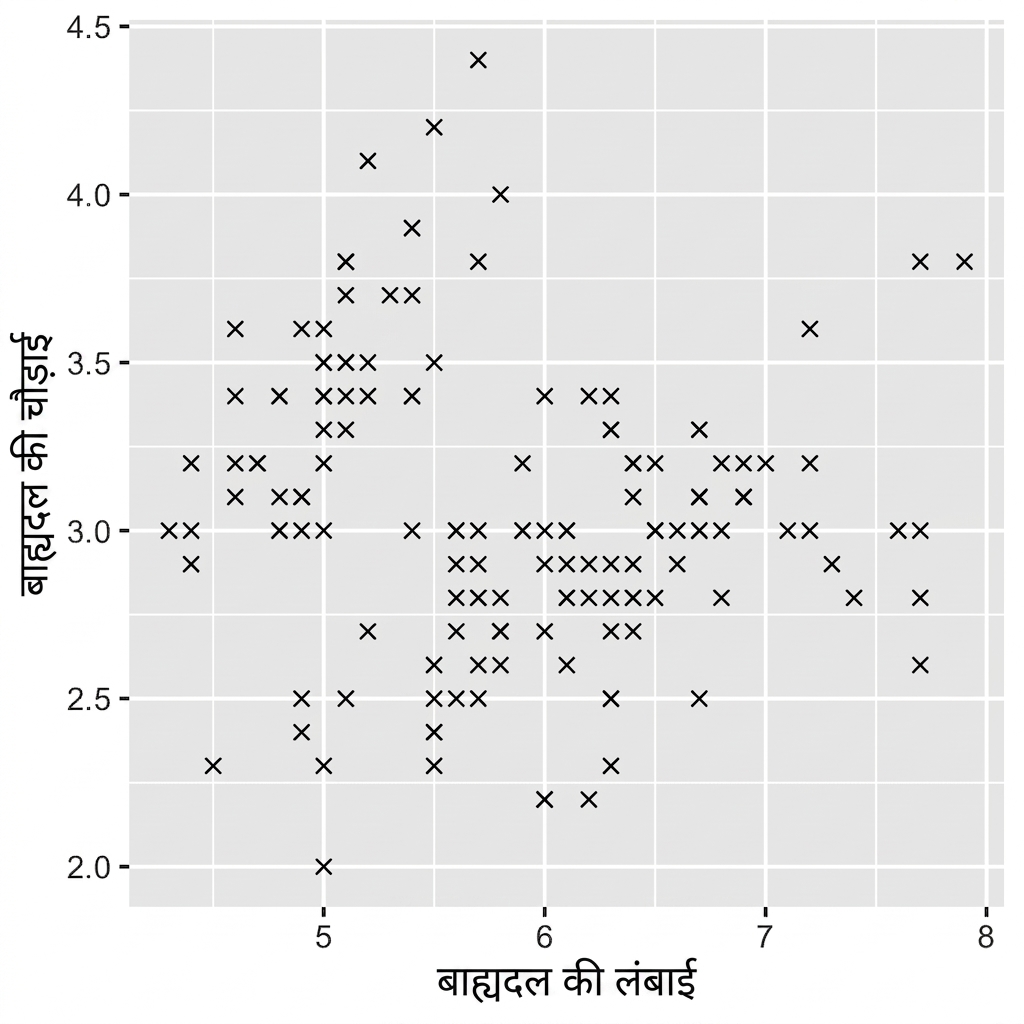
geom_point(shape = 4)
| Type | Property |
|---|---|
| Shape | 4 |

ggplot2 के साथ डेटा विज़ुअलाइज़ेशन परिचय