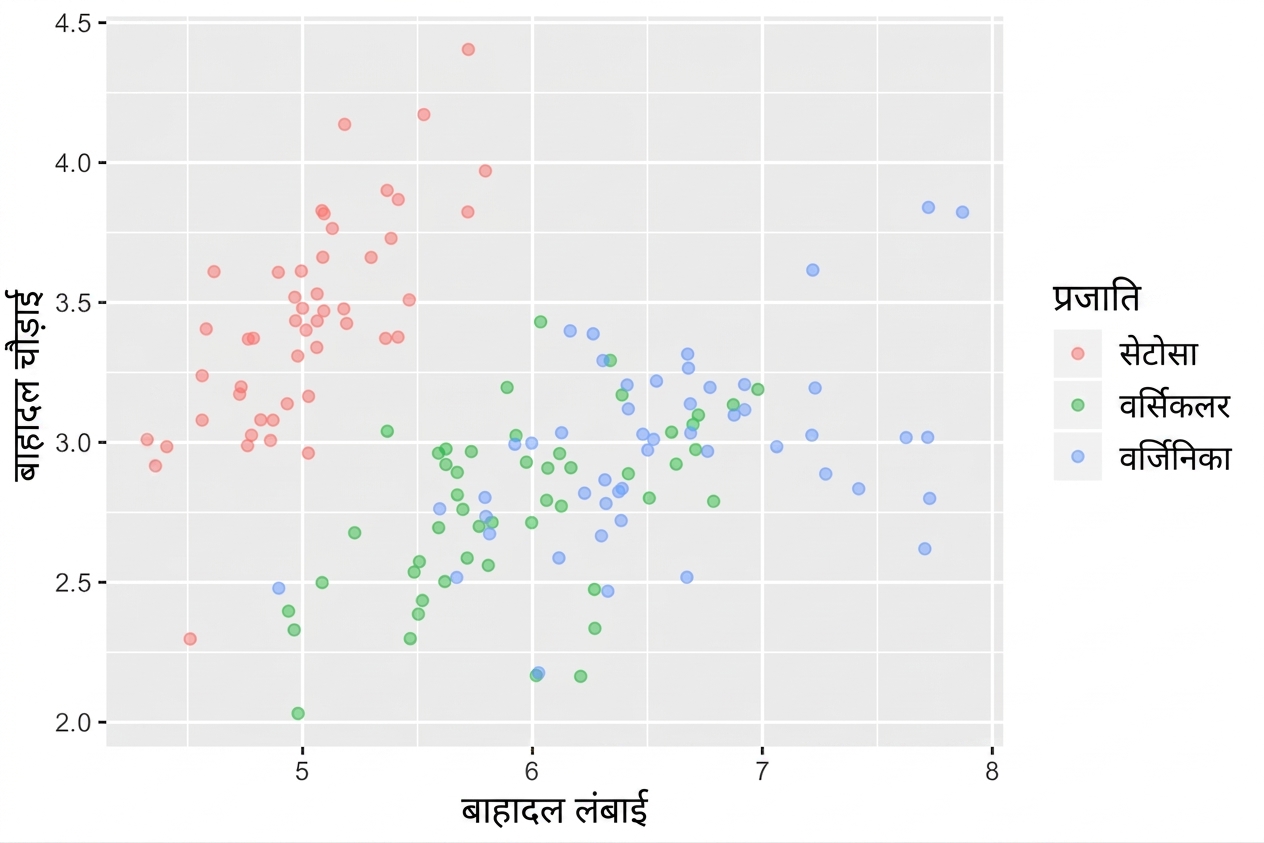
Aesthetics के सर्वोत्तम तरीके
ggplot2 के साथ डेटा विज़ुअलाइज़ेशन परिचय

Rick Scavetta
Founder, Scavetta Academy
रूप, कार्य का अनुसरण करता है

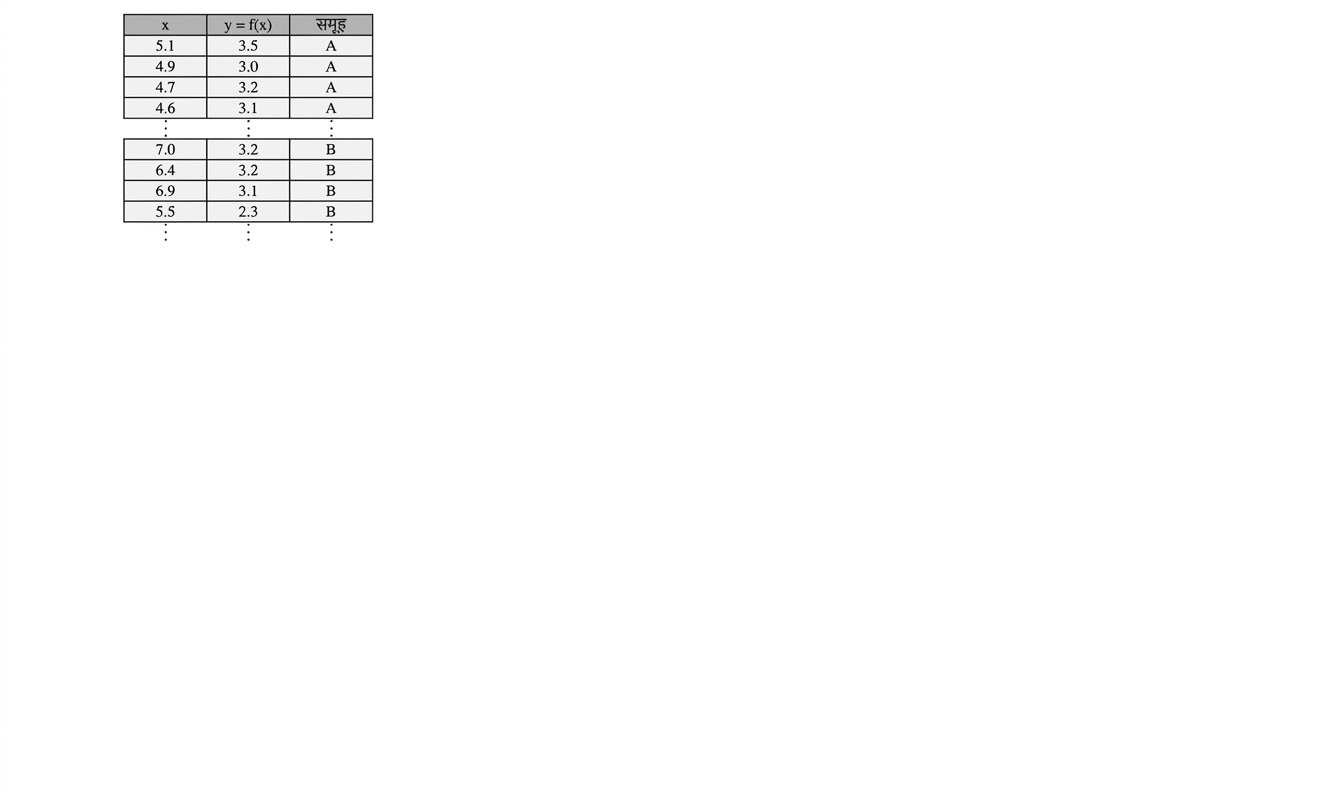
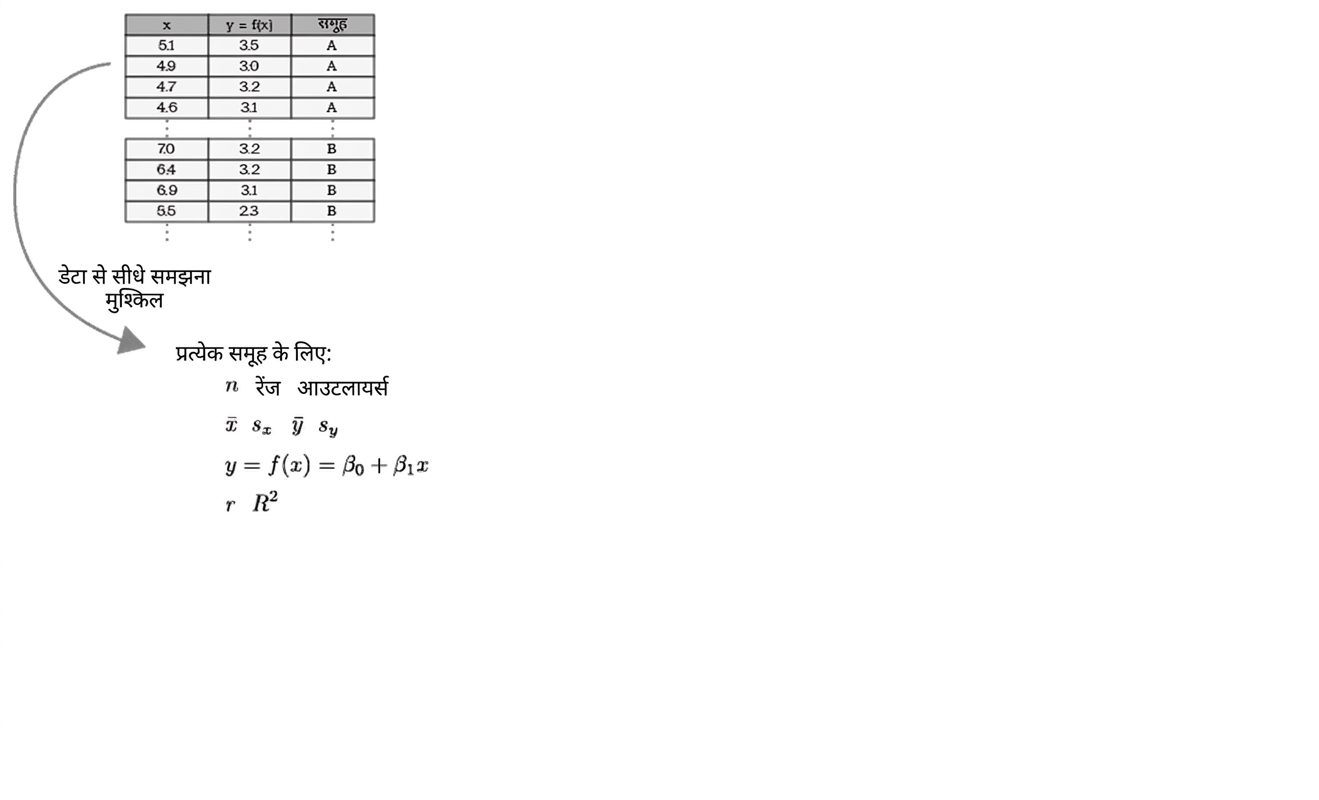
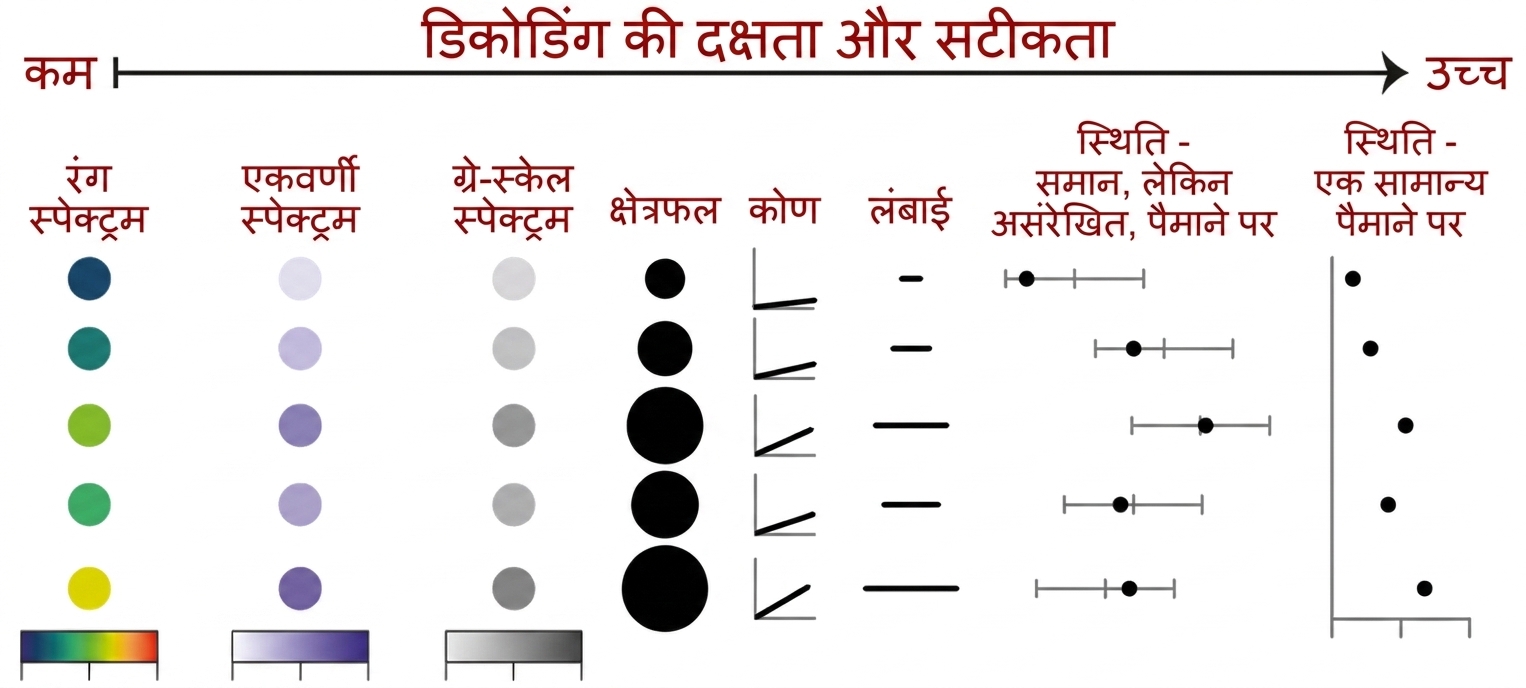
डेटा से जानकारी निकालना

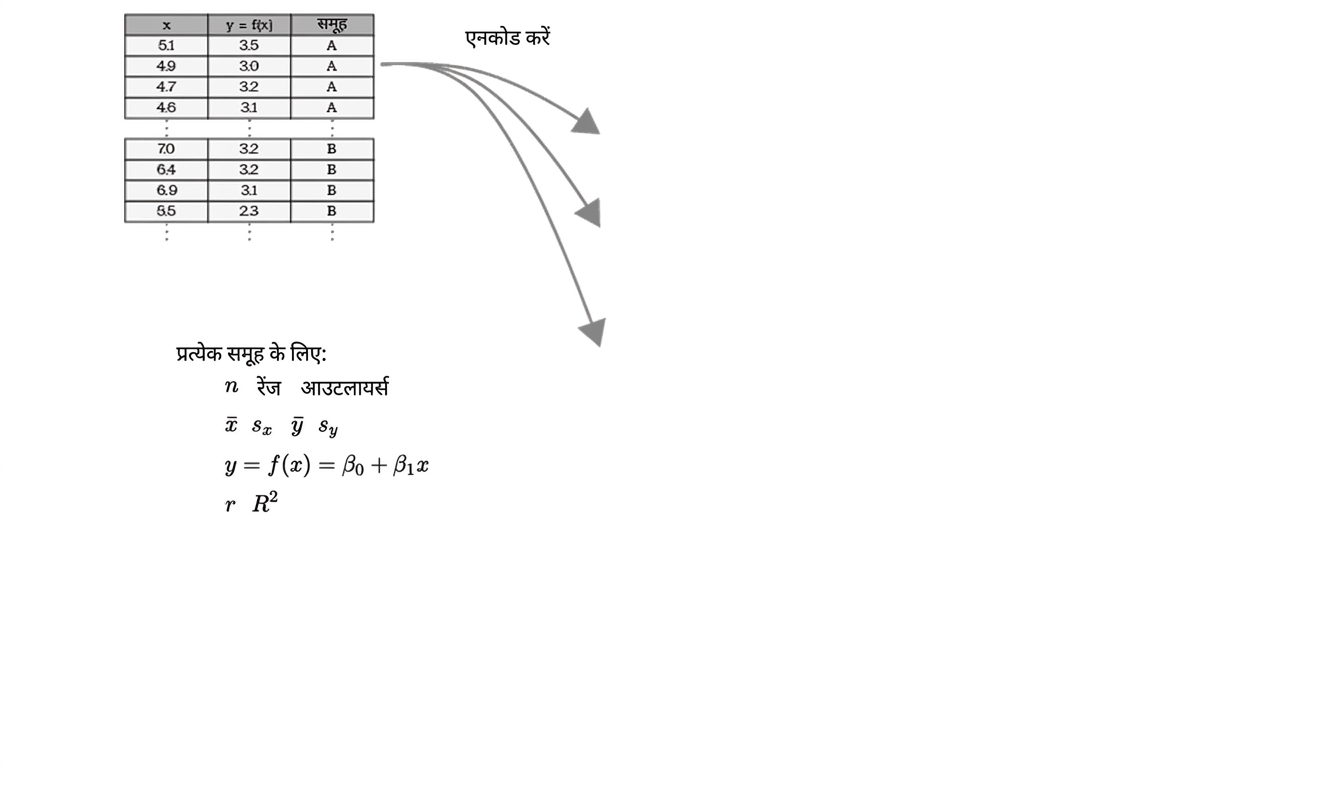
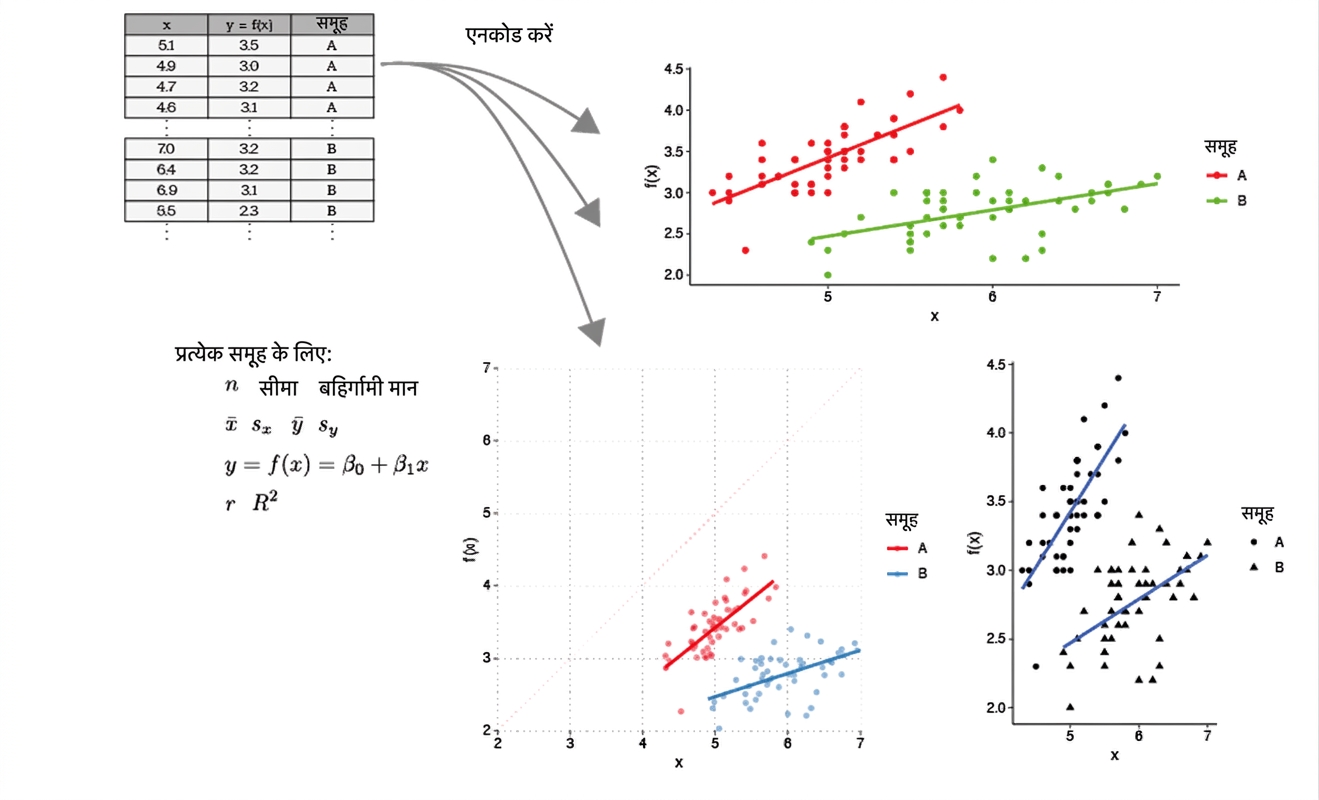
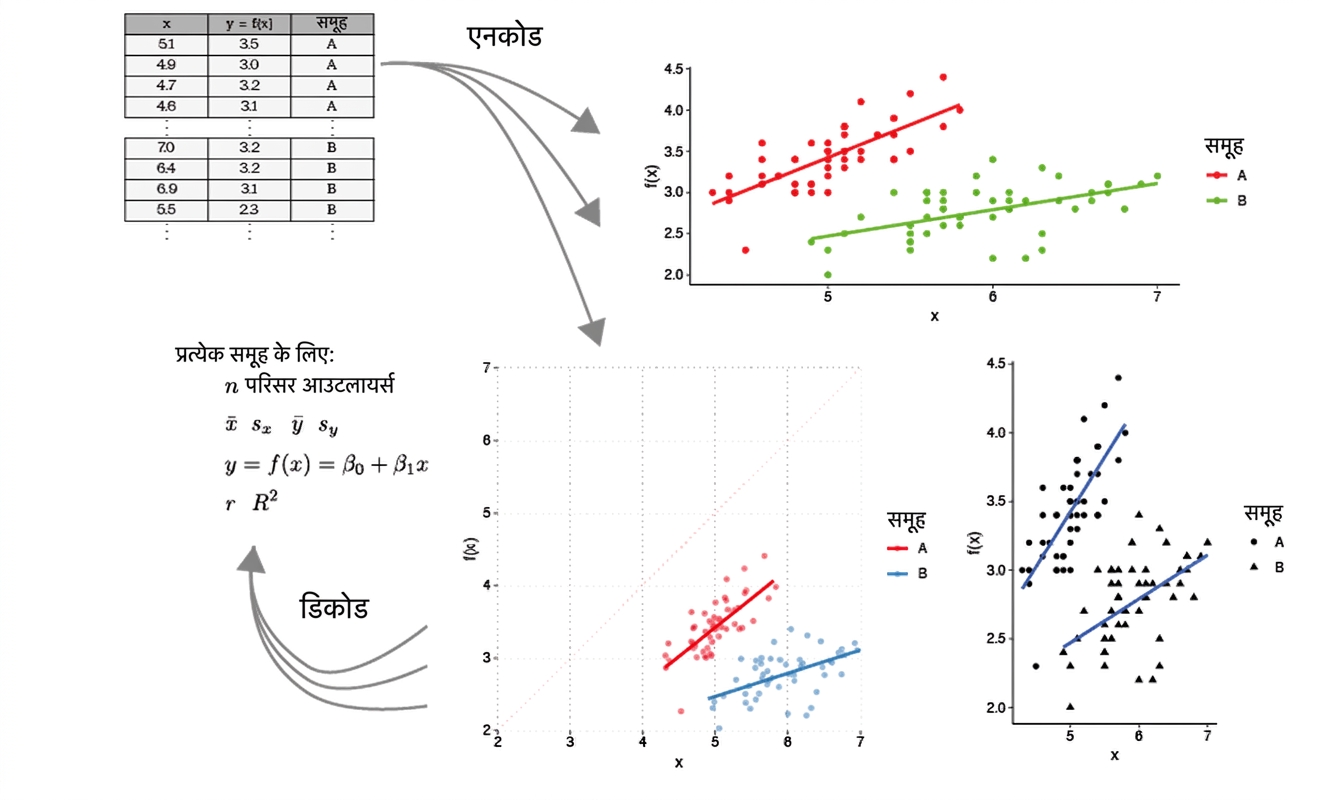
Aesthetics - continuous variables
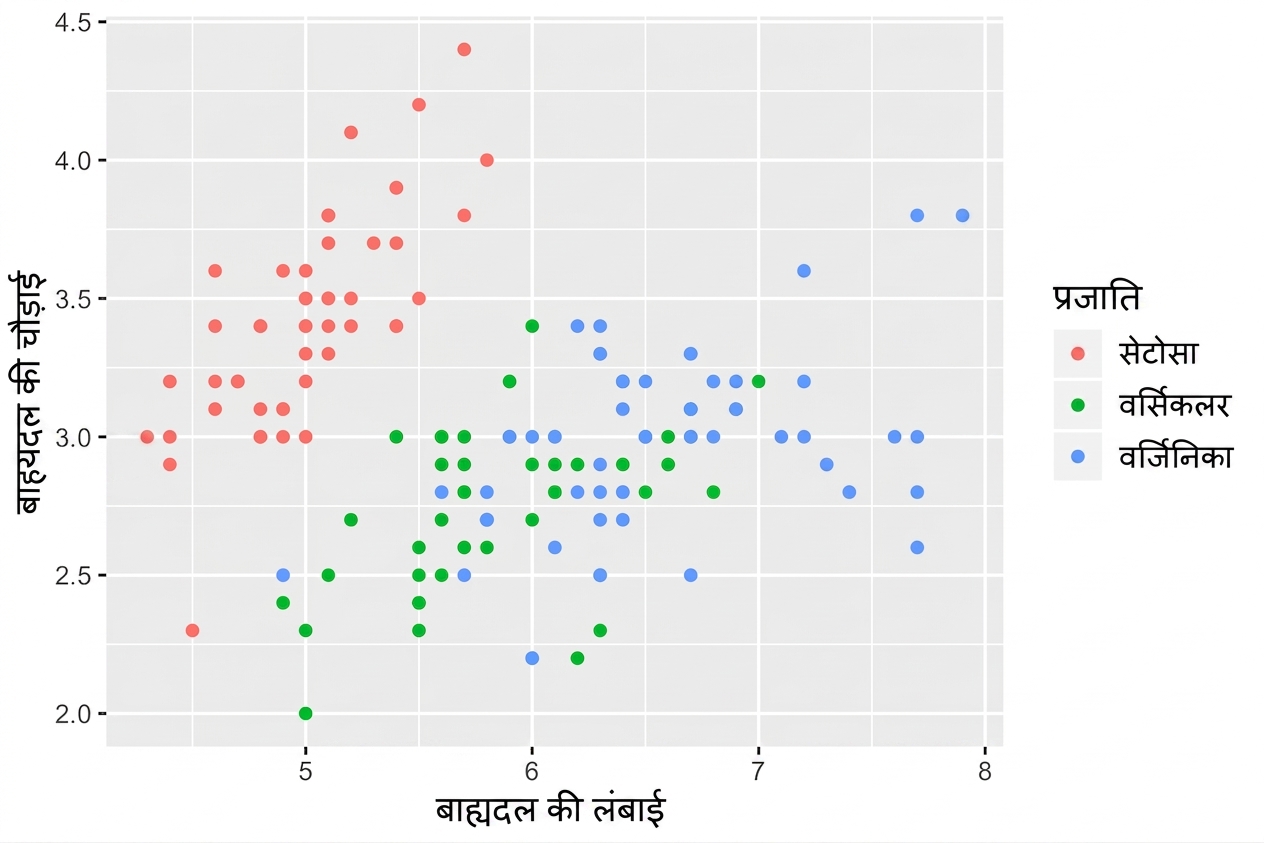
Aesthetics - continuous variables
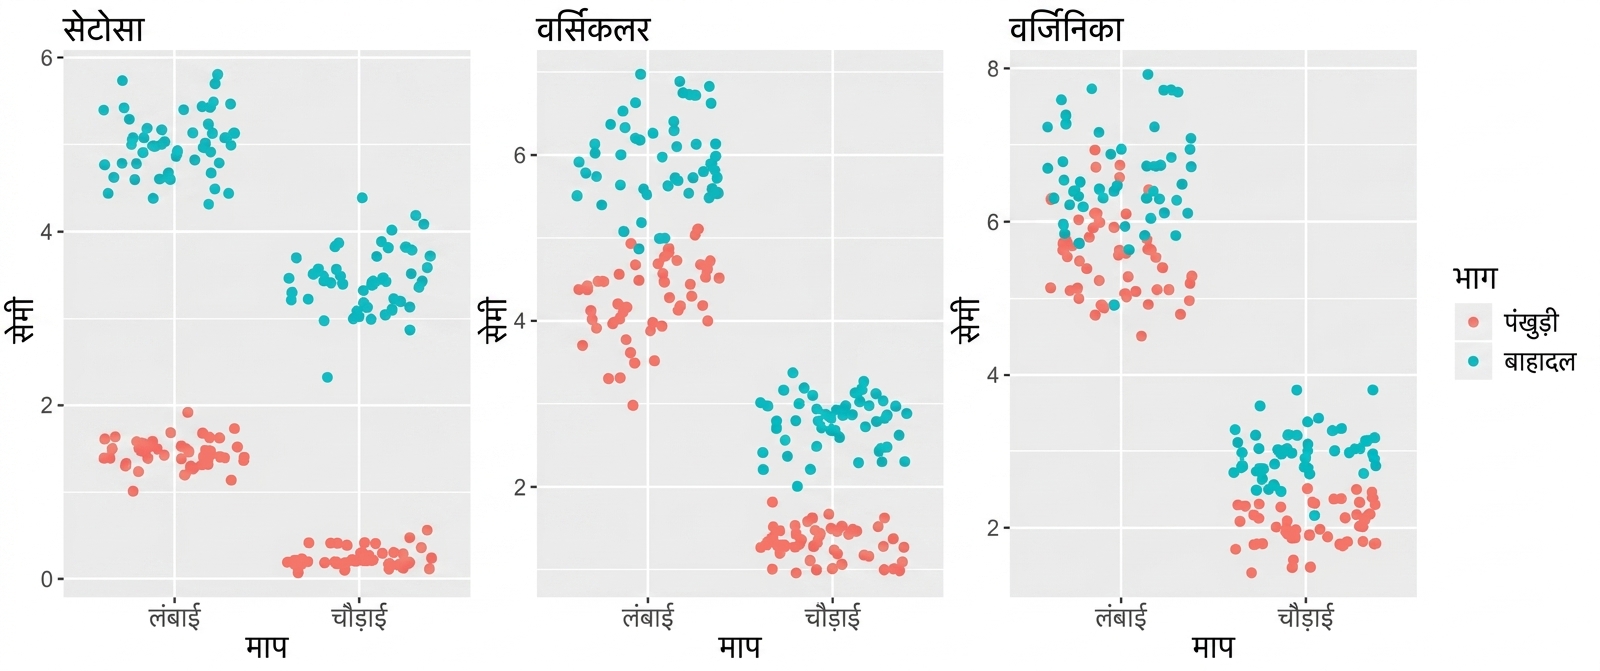
तीन iris स्कैटर प्लॉट्स
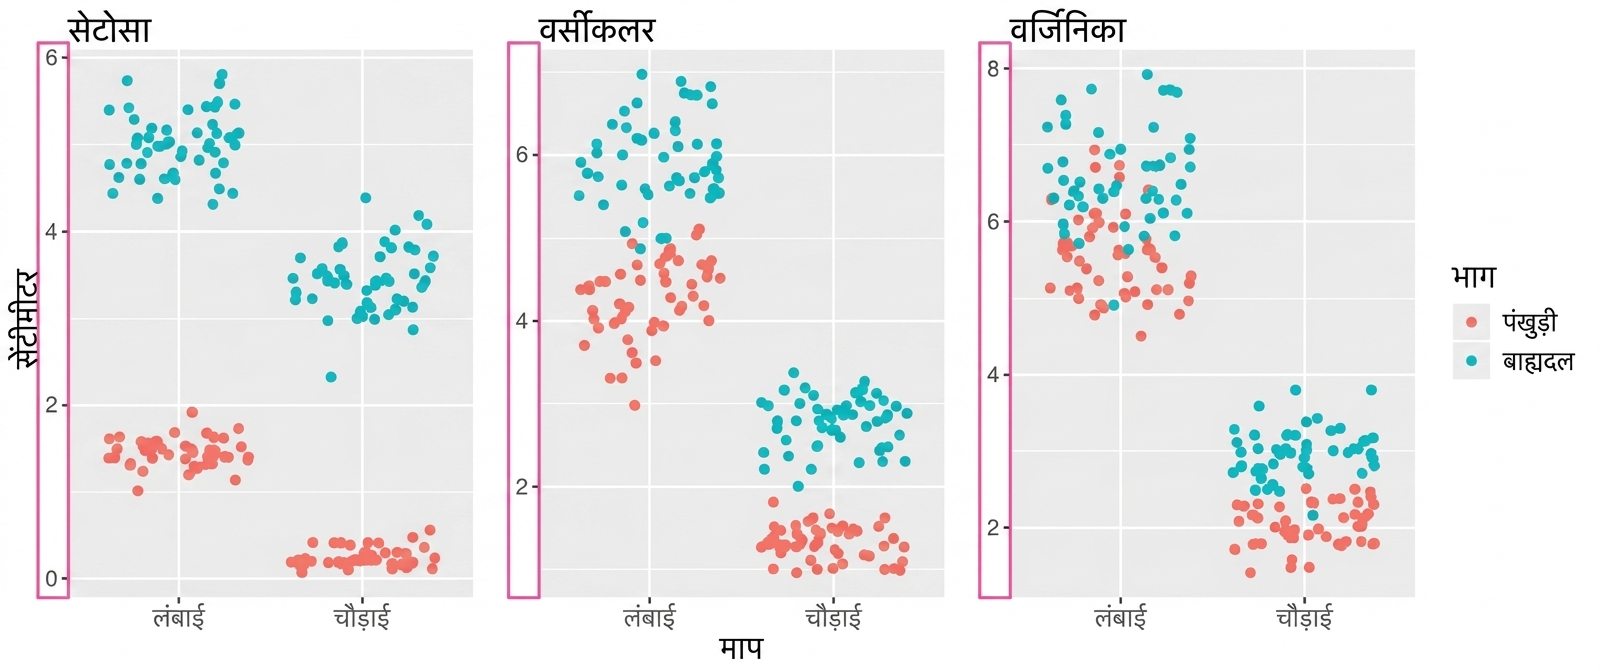
तीन iris स्कैटर प्लॉट्स, y-एक्सिस असंरेखित
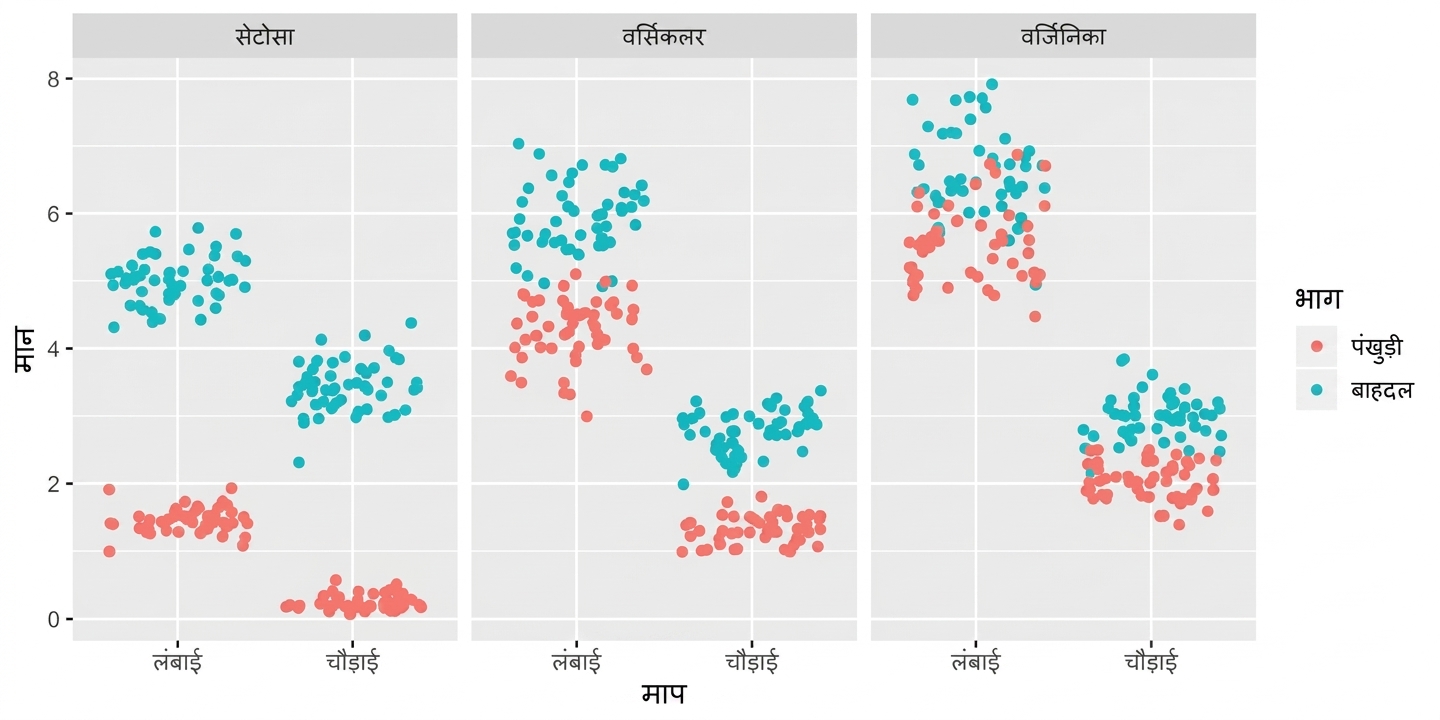
सिंगल faceted प्लॉट, कॉमन y-एक्सिस
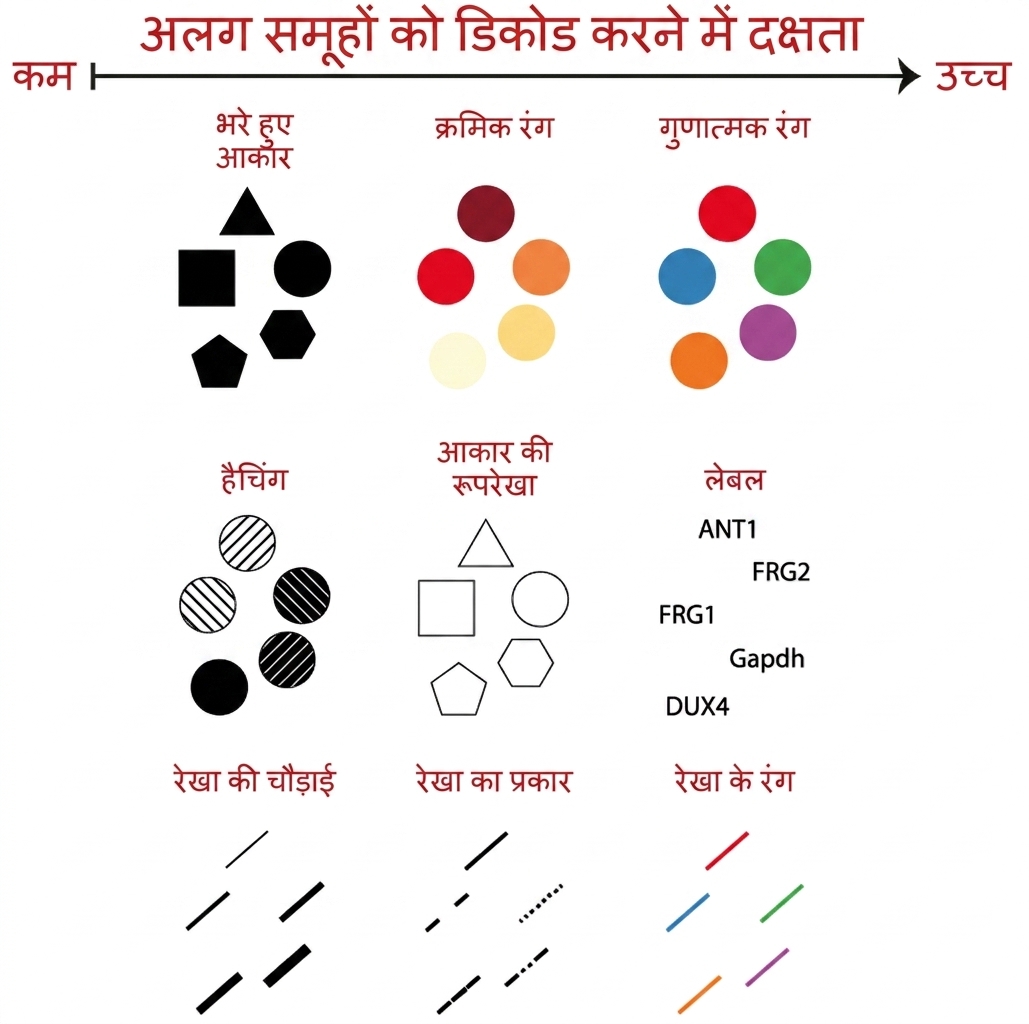
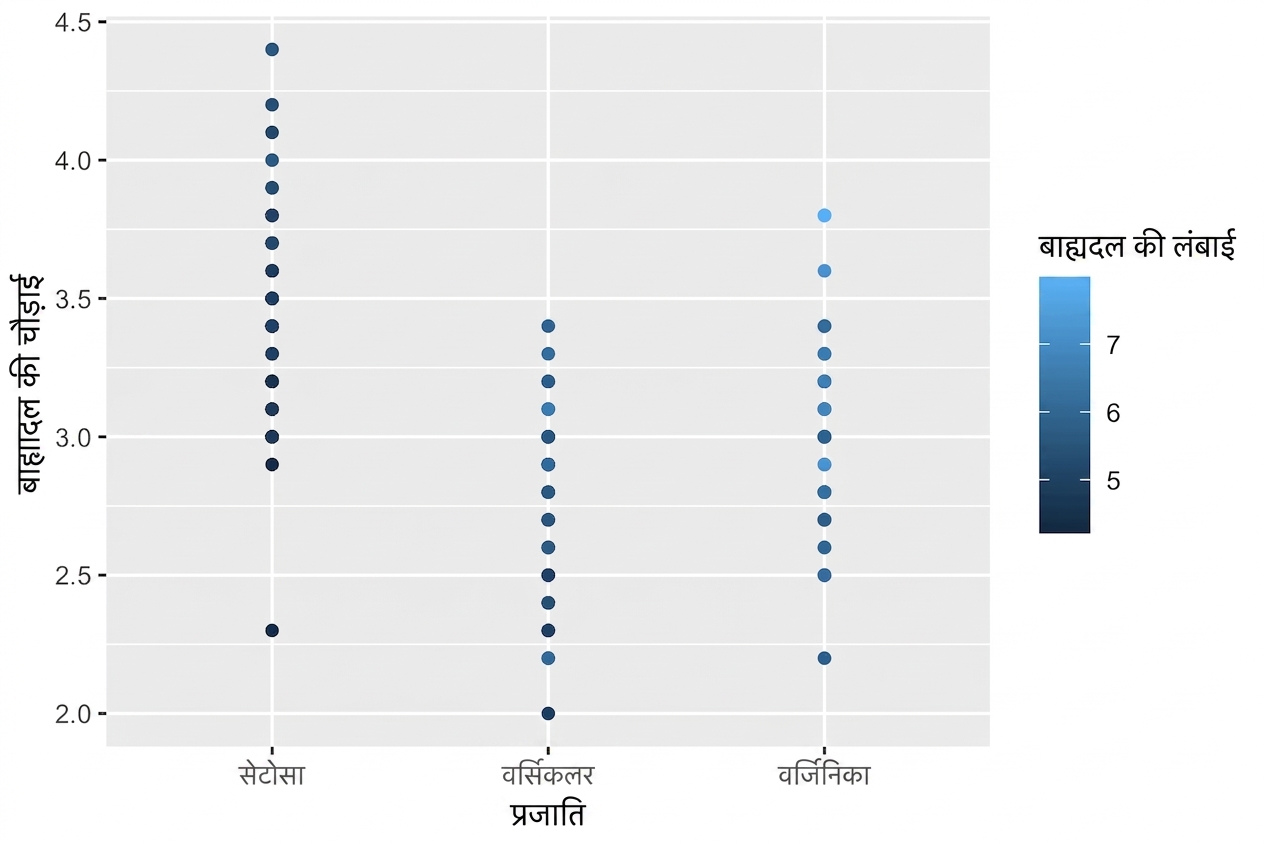
Aesthetics - categorical variables
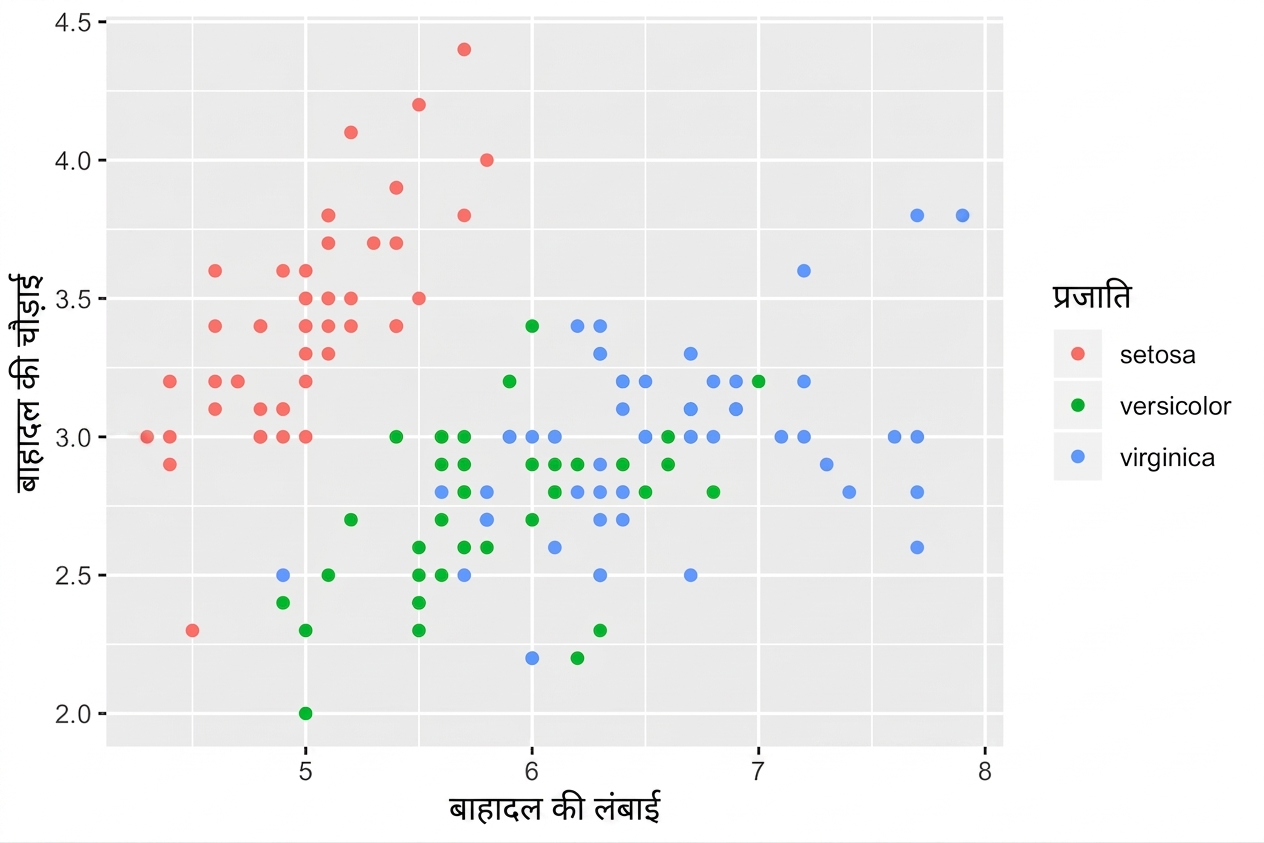
Aesthetics - categorical variables