ความยืดหยุ่นของธีม

การแสดงผลข้อมูลด้วย ggplot2 เบื้องต้น

Rick Scavetta

Founder, Scavetta Academy

วิธีใช้งานธีม

  1. สร้างจากศูนย์ (วิดีโอที่แล้ว)
การแสดงผลข้อมูลด้วย ggplot2 เบื้องต้น

วิธีใช้งานธีม

  1. สร้างจากศูนย์ (วิดีโอที่แล้ว)
  2. อ็อบเจกต์เลเยอร์ธีม
  3. ธีมในตัว
    • แพ็กเกจ ggplot2 หรือ ggthemes
  4. ธีมในตัวจากแพ็กเกจอื่น
  5. อัปเดต/กำหนดธีมเริ่มต้น
การแสดงผลข้อมูลด้วย ggplot2 เบื้องต้น

การกำหนดอ็อบเจกต์ธีม

  • มีประโยชน์เมื่อมีพล็อตหลายกราฟ
  • ช่วยให้สไตล์สอดคล้องกัน
  • นำธีมเดียวไปใช้กับทุกที่
การแสดงผลข้อมูลด้วย ggplot2 เบื้องต้น

การกำหนดอ็อบเจกต์ธีม

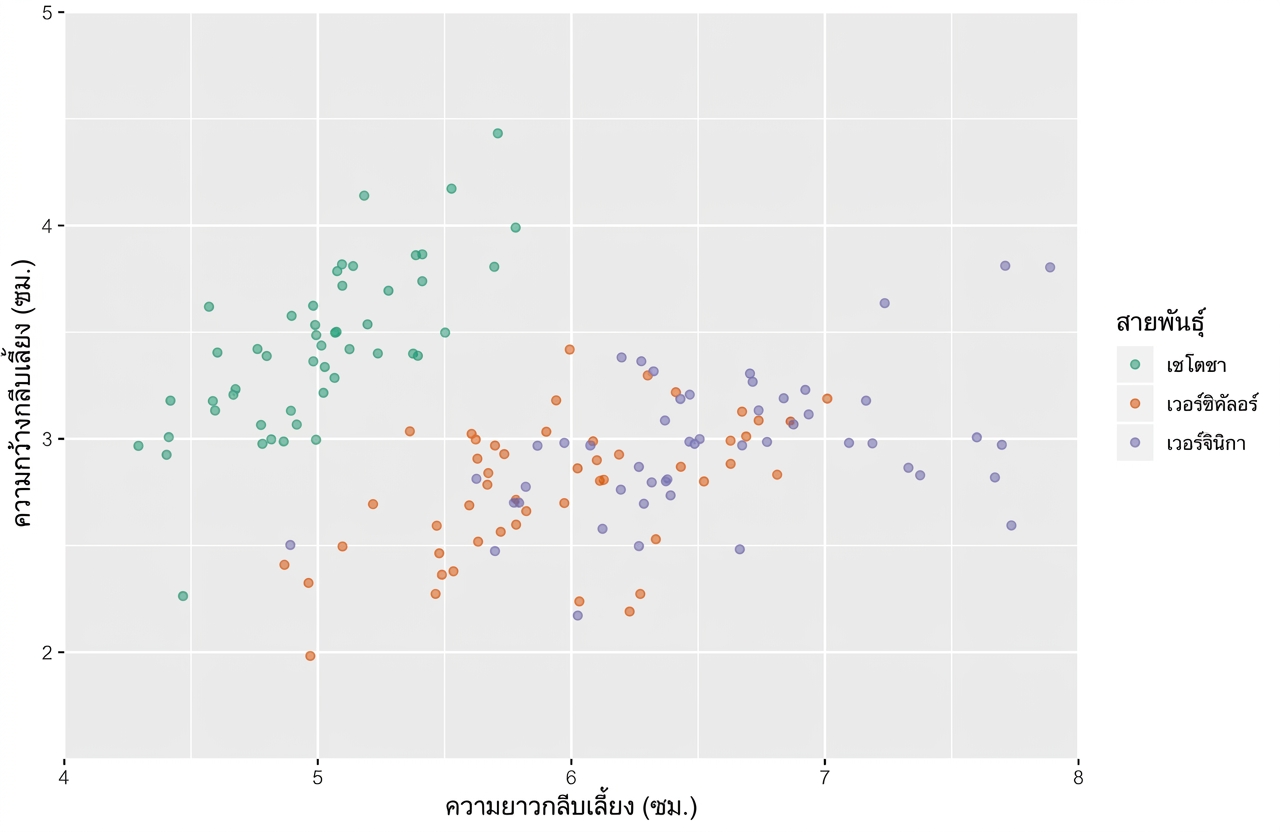
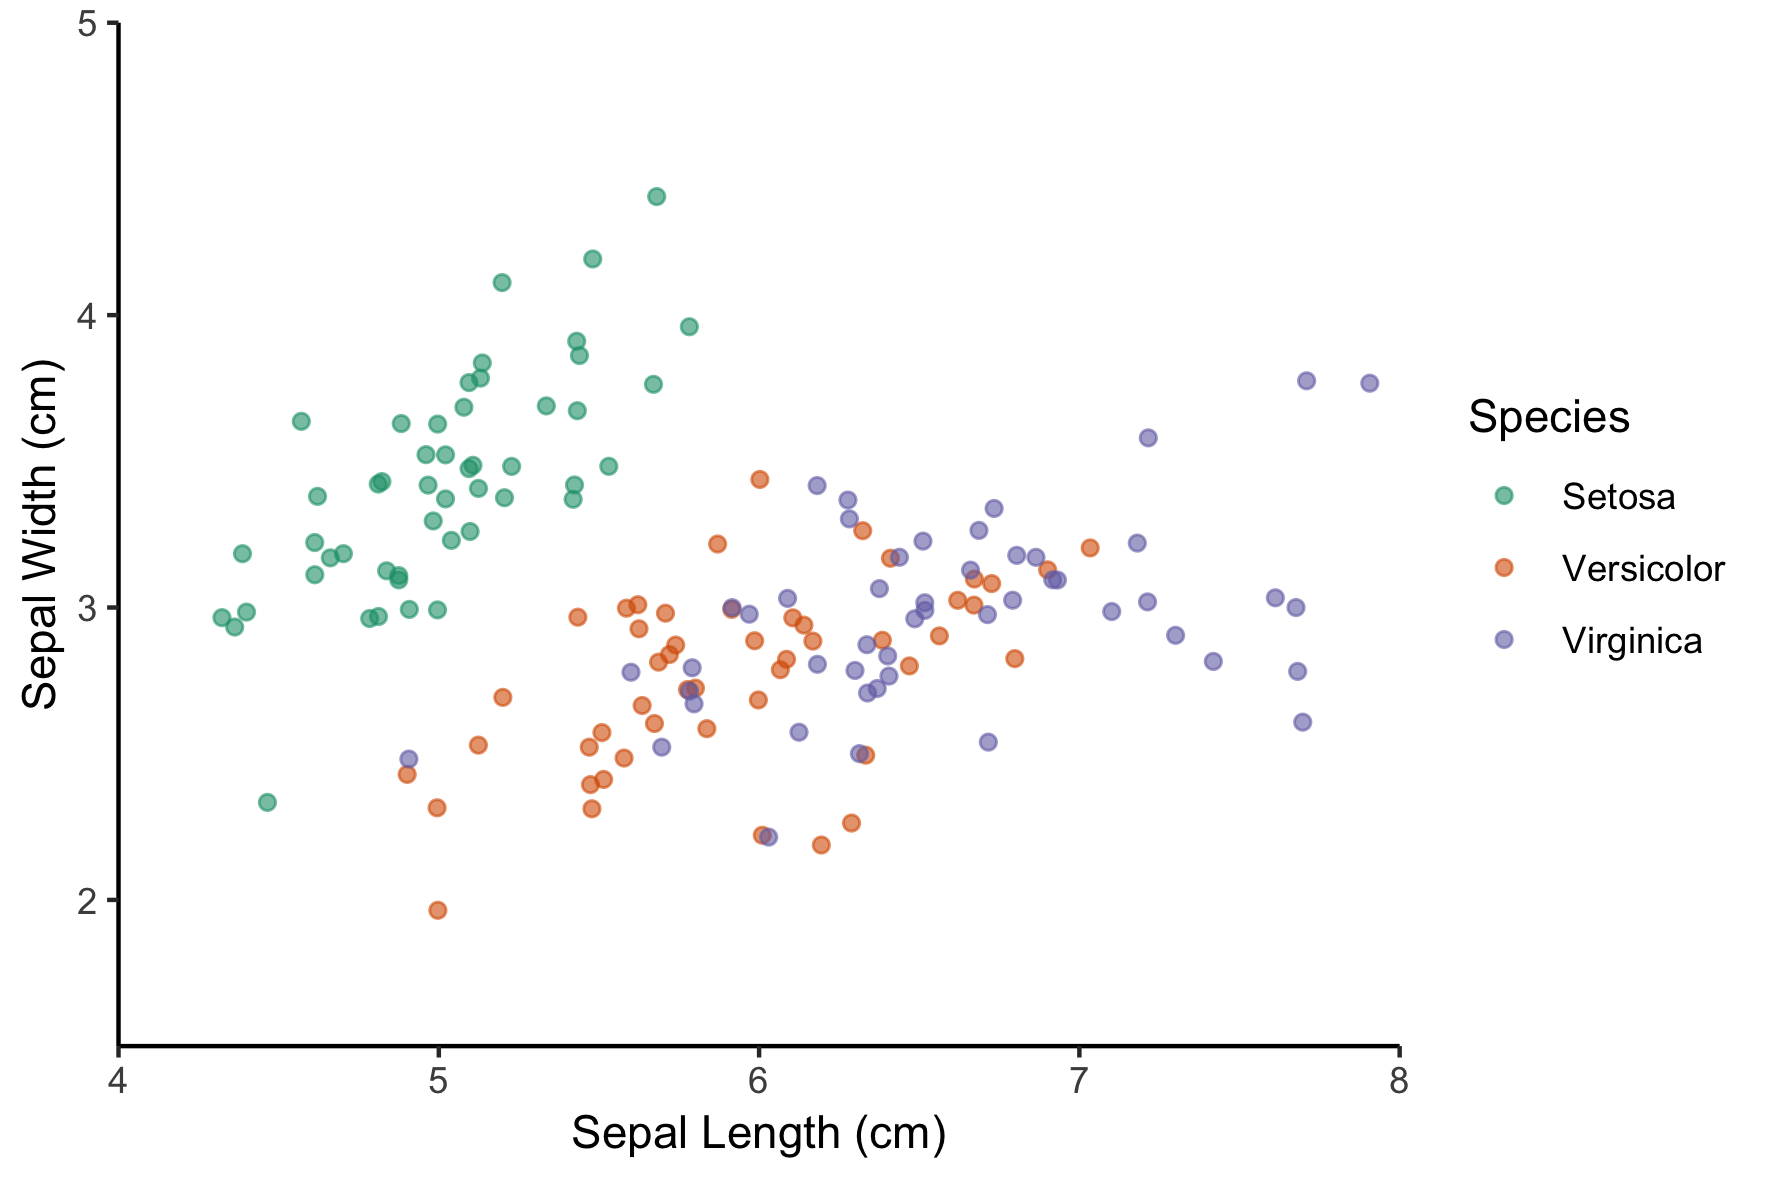
z <- ggplot(iris, aes(x = Sepal.Length, y = Sepal.Width, color = Species)) + 
  geom_jitter(alpha = 0.6) +
  scale_x_continuous("Sepal Length (cm)", limits = c(4,8), expand = c(0,0)) +
  scale_y_continuous("Sepal Width (cm)", limits = c(1.5,5), expand = c(0,0)) +
  scale_color_brewer("Species", palette = "Dark2", labels = c("Setosa", "Versicolor", "Virginica"))
การแสดงผลข้อมูลด้วย ggplot2 เบื้องต้น

การกำหนดอ็อบเจกต์ธีม

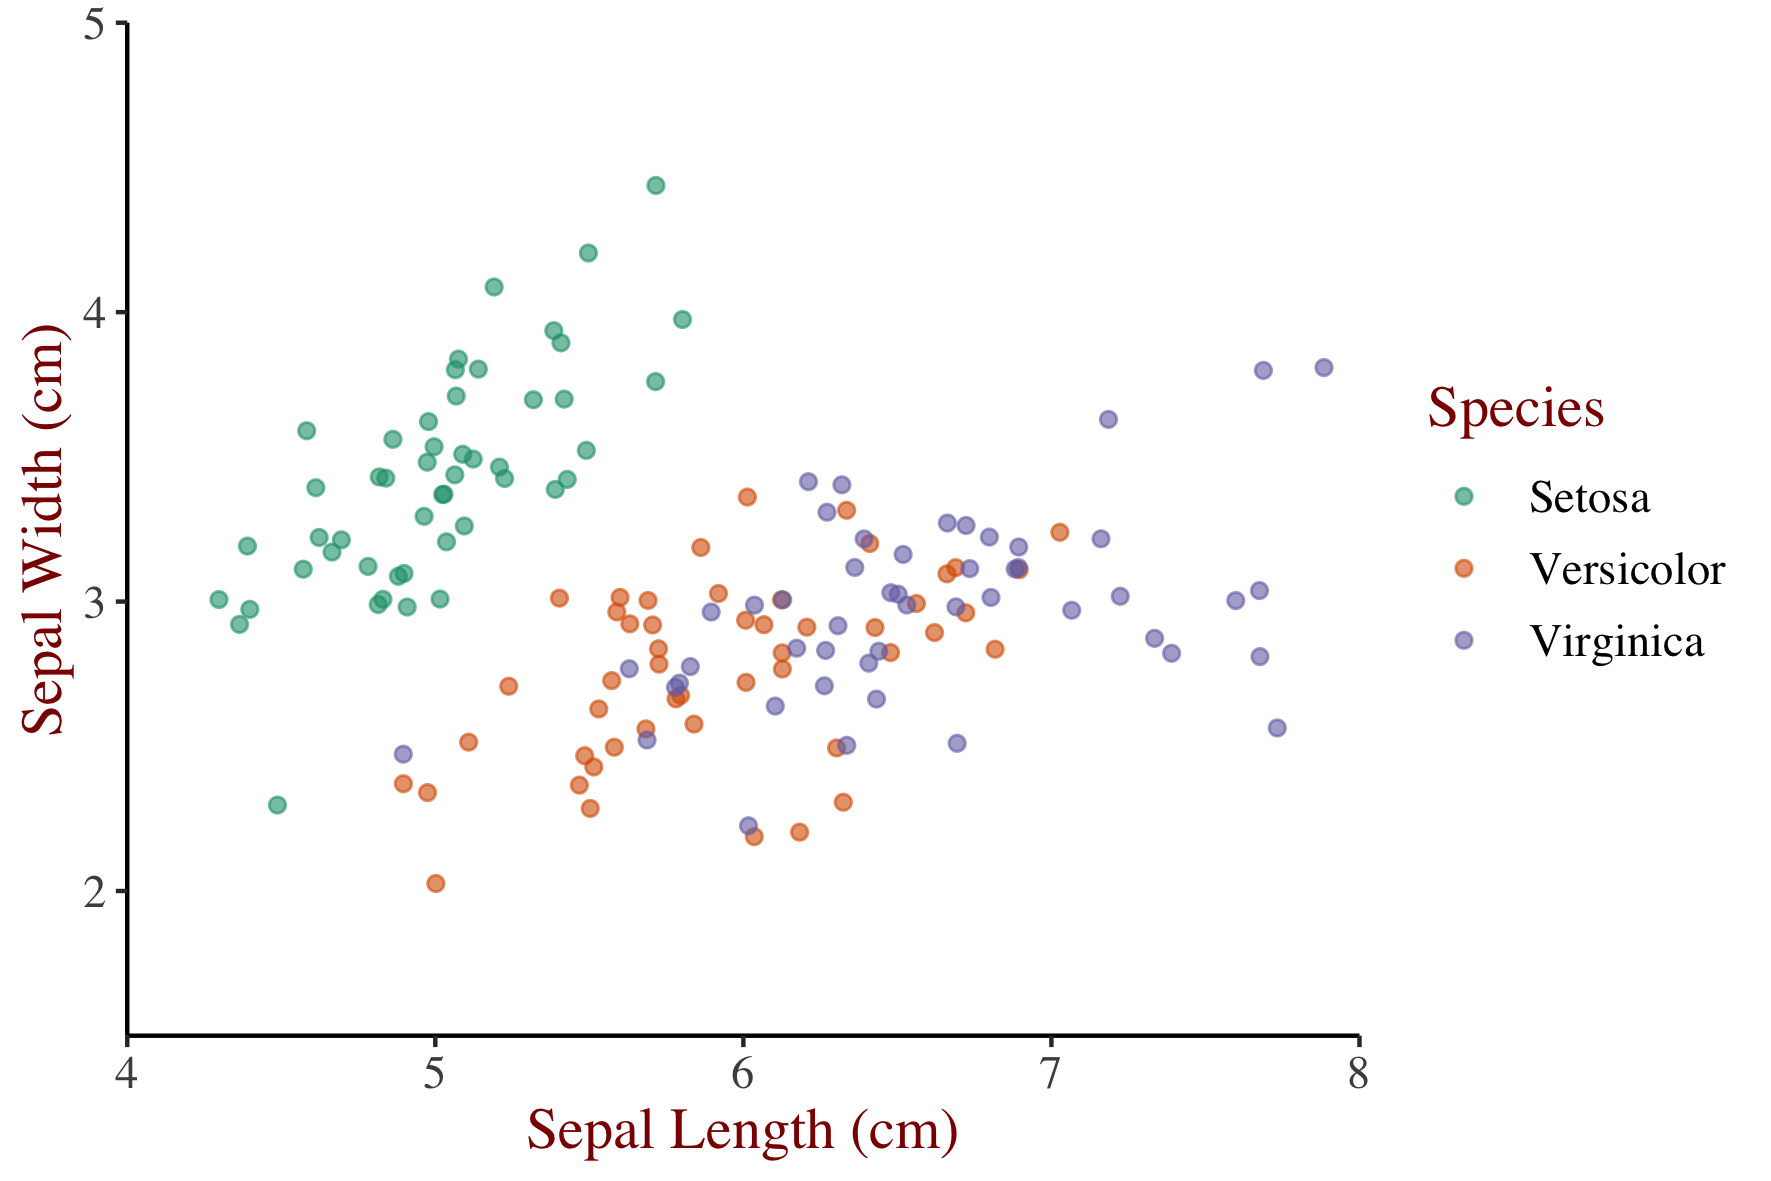
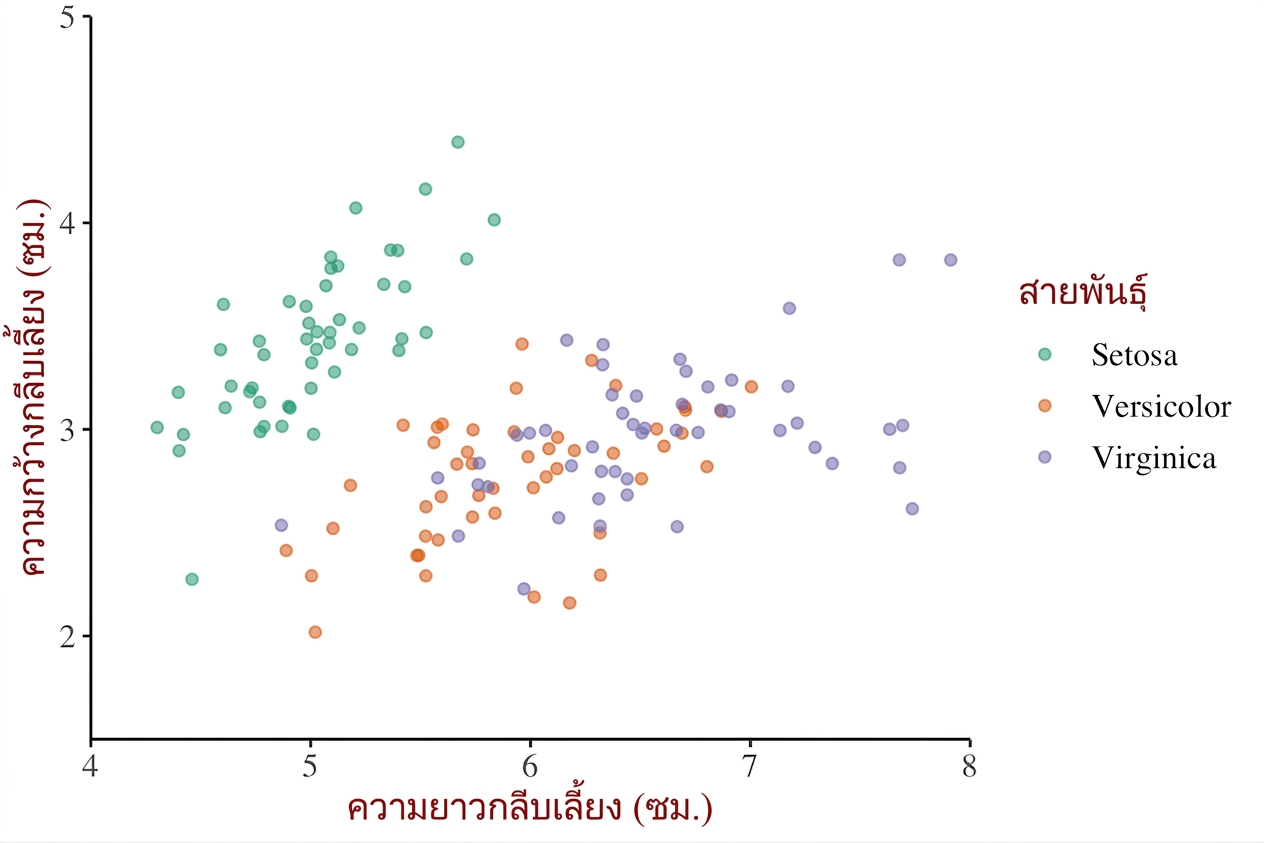
z + theme(text = element_text(family = "serif", size = 14),
          rect = element_blank(),
          panel.grid = element_blank(),
          title = element_text(color = "#8b0000"),
          axis.line = element_line(color = "black"))
การแสดงผลข้อมูลด้วย ggplot2 เบื้องต้น

การกำหนดอ็อบเจกต์ธีม

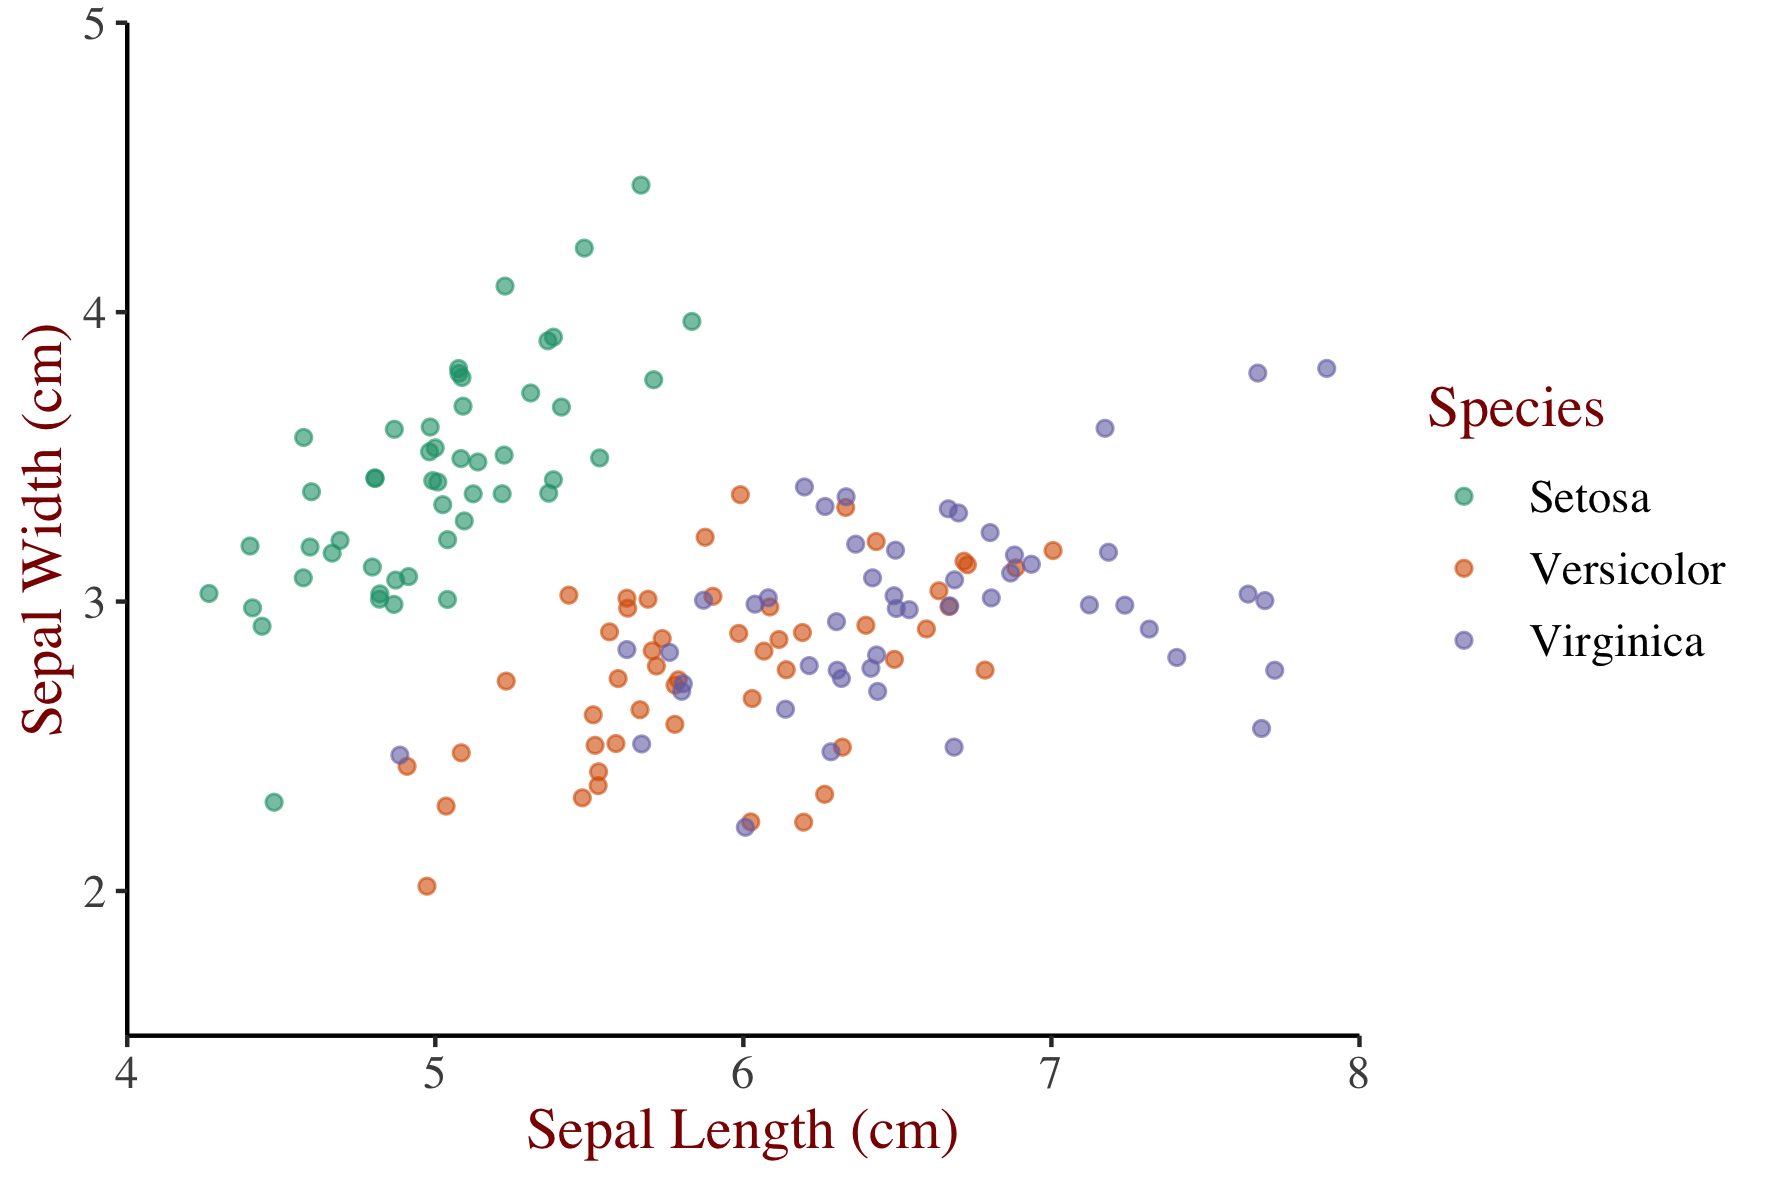
theme_iris <- theme(text = element_text(family = "serif", size = 14),
          rect = element_blank(),
          panel.grid = element_blank(),
          title = element_text(color = "#8b0000"),
          axis.line = element_line(color = "black"))
การแสดงผลข้อมูลด้วย ggplot2 เบื้องต้น

การนำอ็อบเจกต์ธีมกลับมาใช้ซ้ำ

z + theme_iris
การแสดงผลข้อมูลด้วย ggplot2 เบื้องต้น

การนำอ็อบเจกต์ธีมกลับมาใช้ซ้ำ

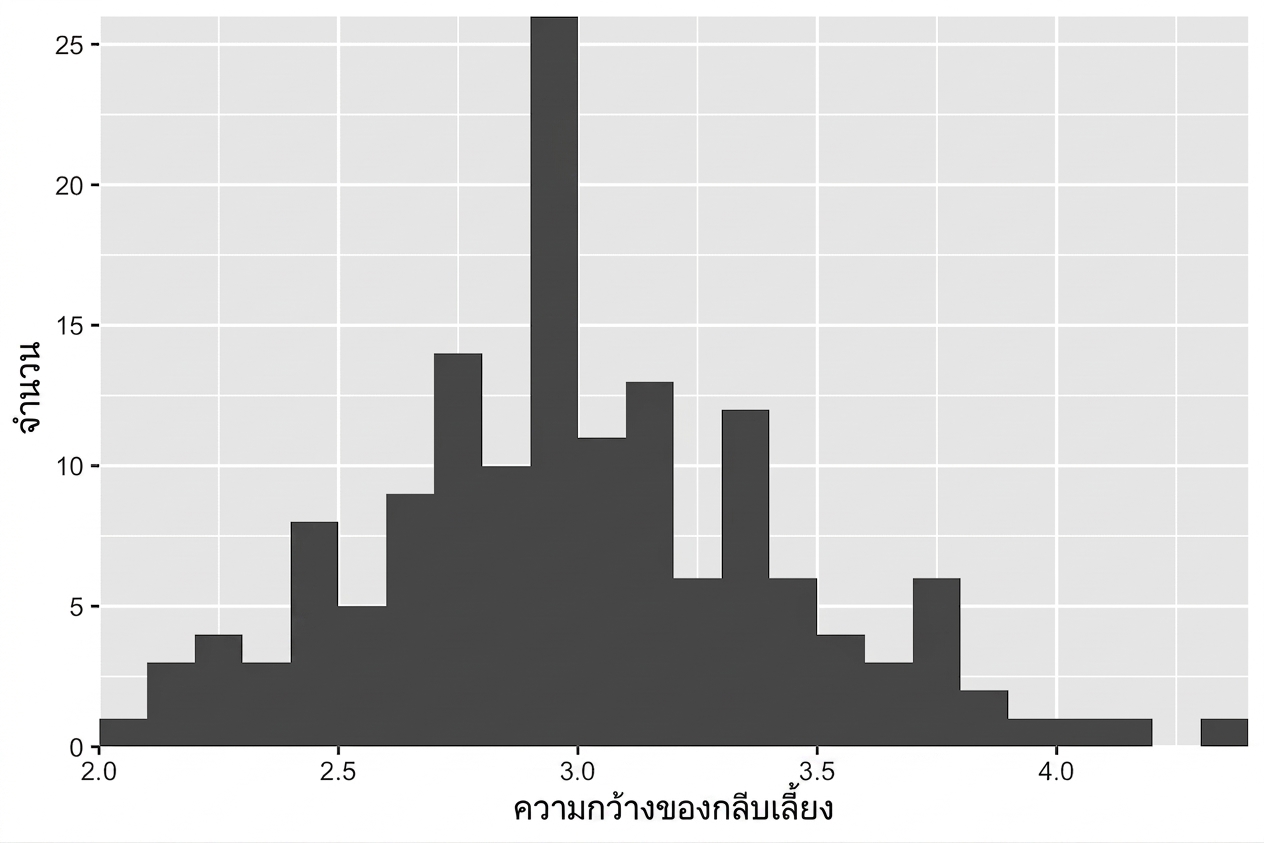
m <- ggplot(iris, aes(x = Sepal.Width)) + 
    geom_histogram(binwidth = 0.1,
                   center = 0.05)
m                 
การแสดงผลข้อมูลด้วย ggplot2 เบื้องต้น

การนำอ็อบเจกต์ธีมกลับมาใช้ซ้ำ

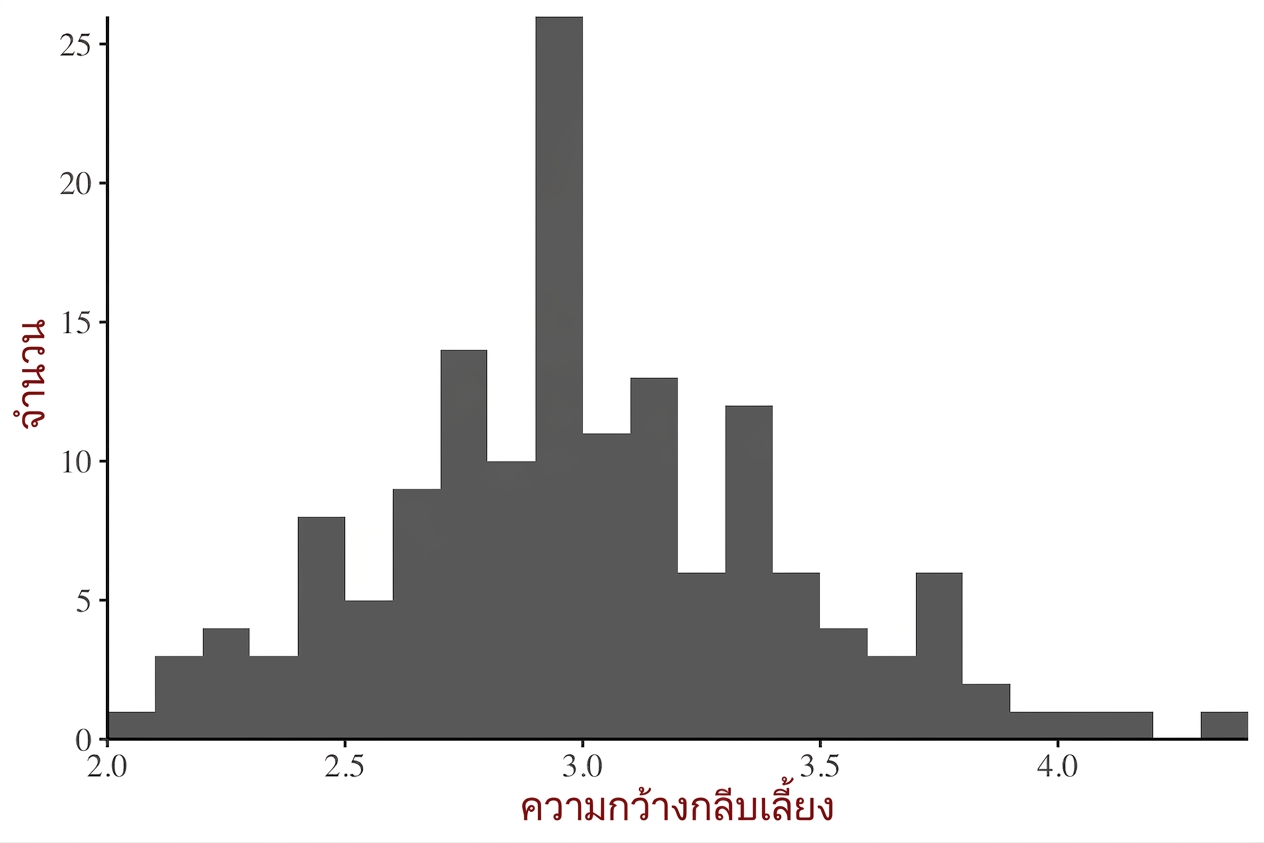
m +
  theme_iris
การแสดงผลข้อมูลด้วย ggplot2 เบื้องต้น

การนำอ็อบเจกต์ธีมกลับมาใช้ซ้ำ

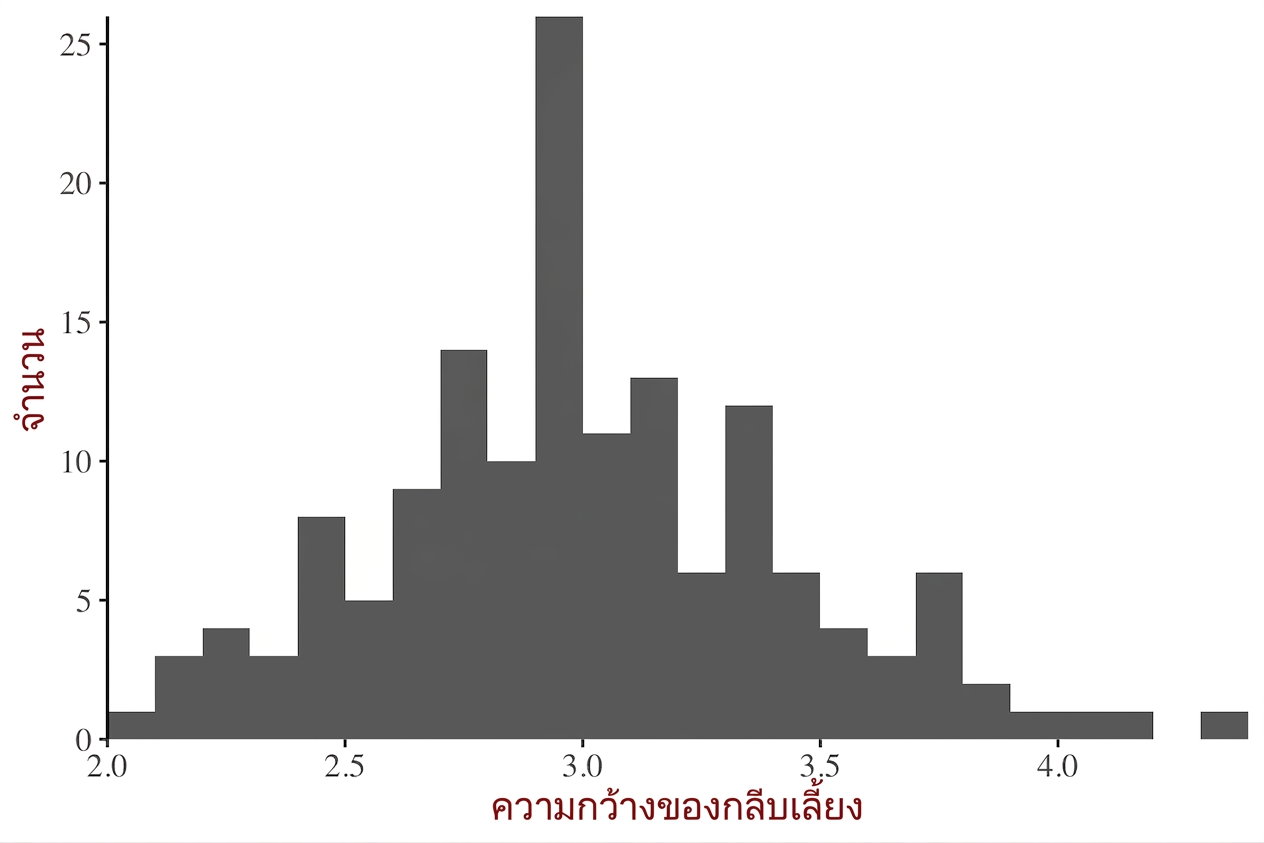
m + 
  theme_iris +
  theme(axis.line.x = element_blank())
การแสดงผลข้อมูลด้วย ggplot2 เบื้องต้น

วิธีใช้งานธีม

  1. สร้างจากศูนย์ (วิดีโอที่แล้ว)
  2. อ็อบเจกต์เลเยอร์ธีม
  3. ธีมในตัว
    • แพ็กเกจ ggplot2 หรือ ggthemes
  4. ธีมในตัวจากแพ็กเกจอื่น
  5. อัปเดต/กำหนดธีมเริ่มต้น
การแสดงผลข้อมูลด้วย ggplot2 เบื้องต้น

การใช้ธีมในตัว

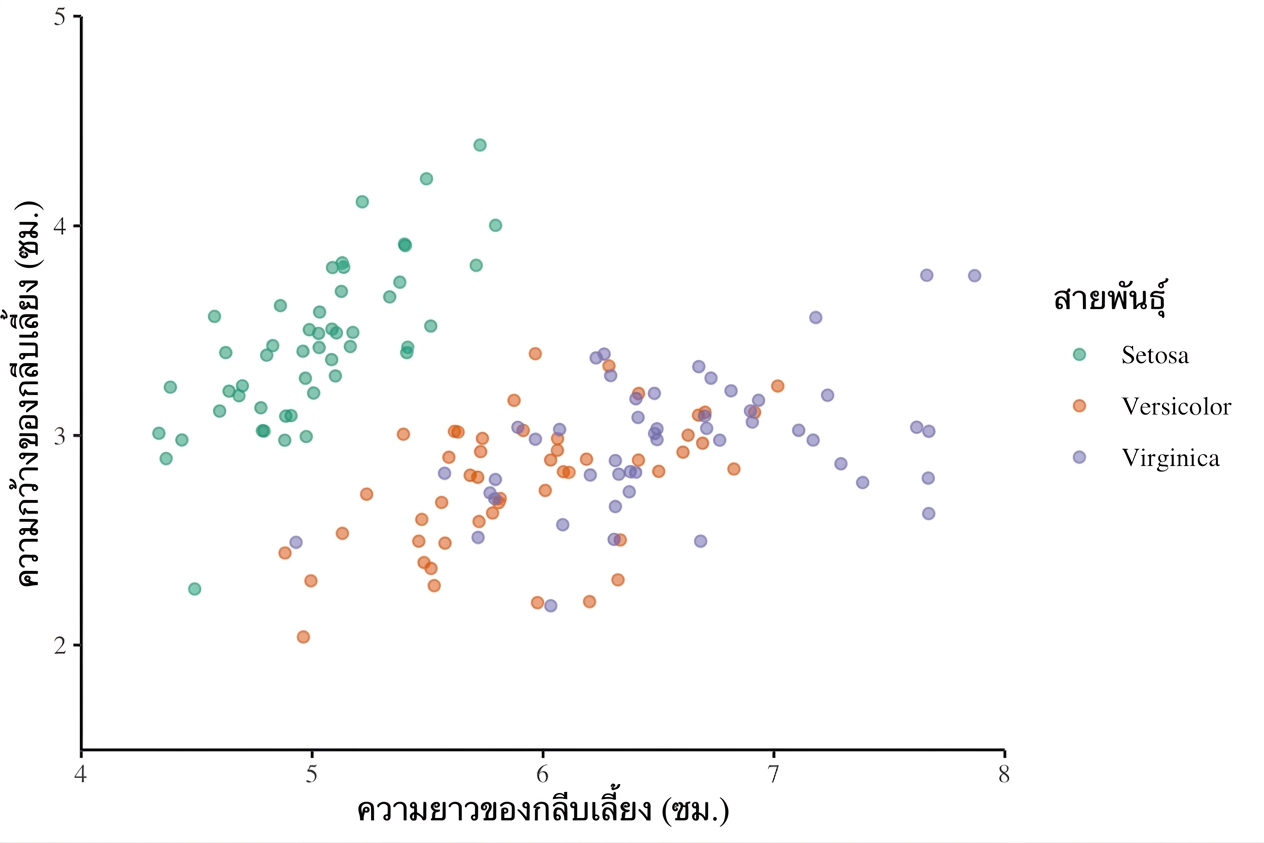
ใช้ฟังก์ชัน theme_*() เพื่อเข้าถึงธีมในตัว

z + 
  theme_classic()
การแสดงผลข้อมูลด้วย ggplot2 เบื้องต้น

การใช้ธีมในตัว

ใช้ฟังก์ชัน theme_*() เพื่อเข้าถึงธีมในตัว

z + 
  theme_classic() +
  theme(text = element_text(family = "serif"))
การแสดงผลข้อมูลด้วย ggplot2 เบื้องต้น

วิธีใช้งานธีม

  1. สร้างจากศูนย์ (วิดีโอที่แล้ว)
  2. อ็อบเจกต์เลเยอร์ธีม
  3. ธีมในตัว
    • แพ็กเกจ ggplot2 หรือ ggthemes
  4. ธีมในตัวจากแพ็กเกจอื่น
  5. อัปเดต/กำหนดธีมเริ่มต้น
การแสดงผลข้อมูลด้วย ggplot2 เบื้องต้น

แพ็กเกจ ggthemes

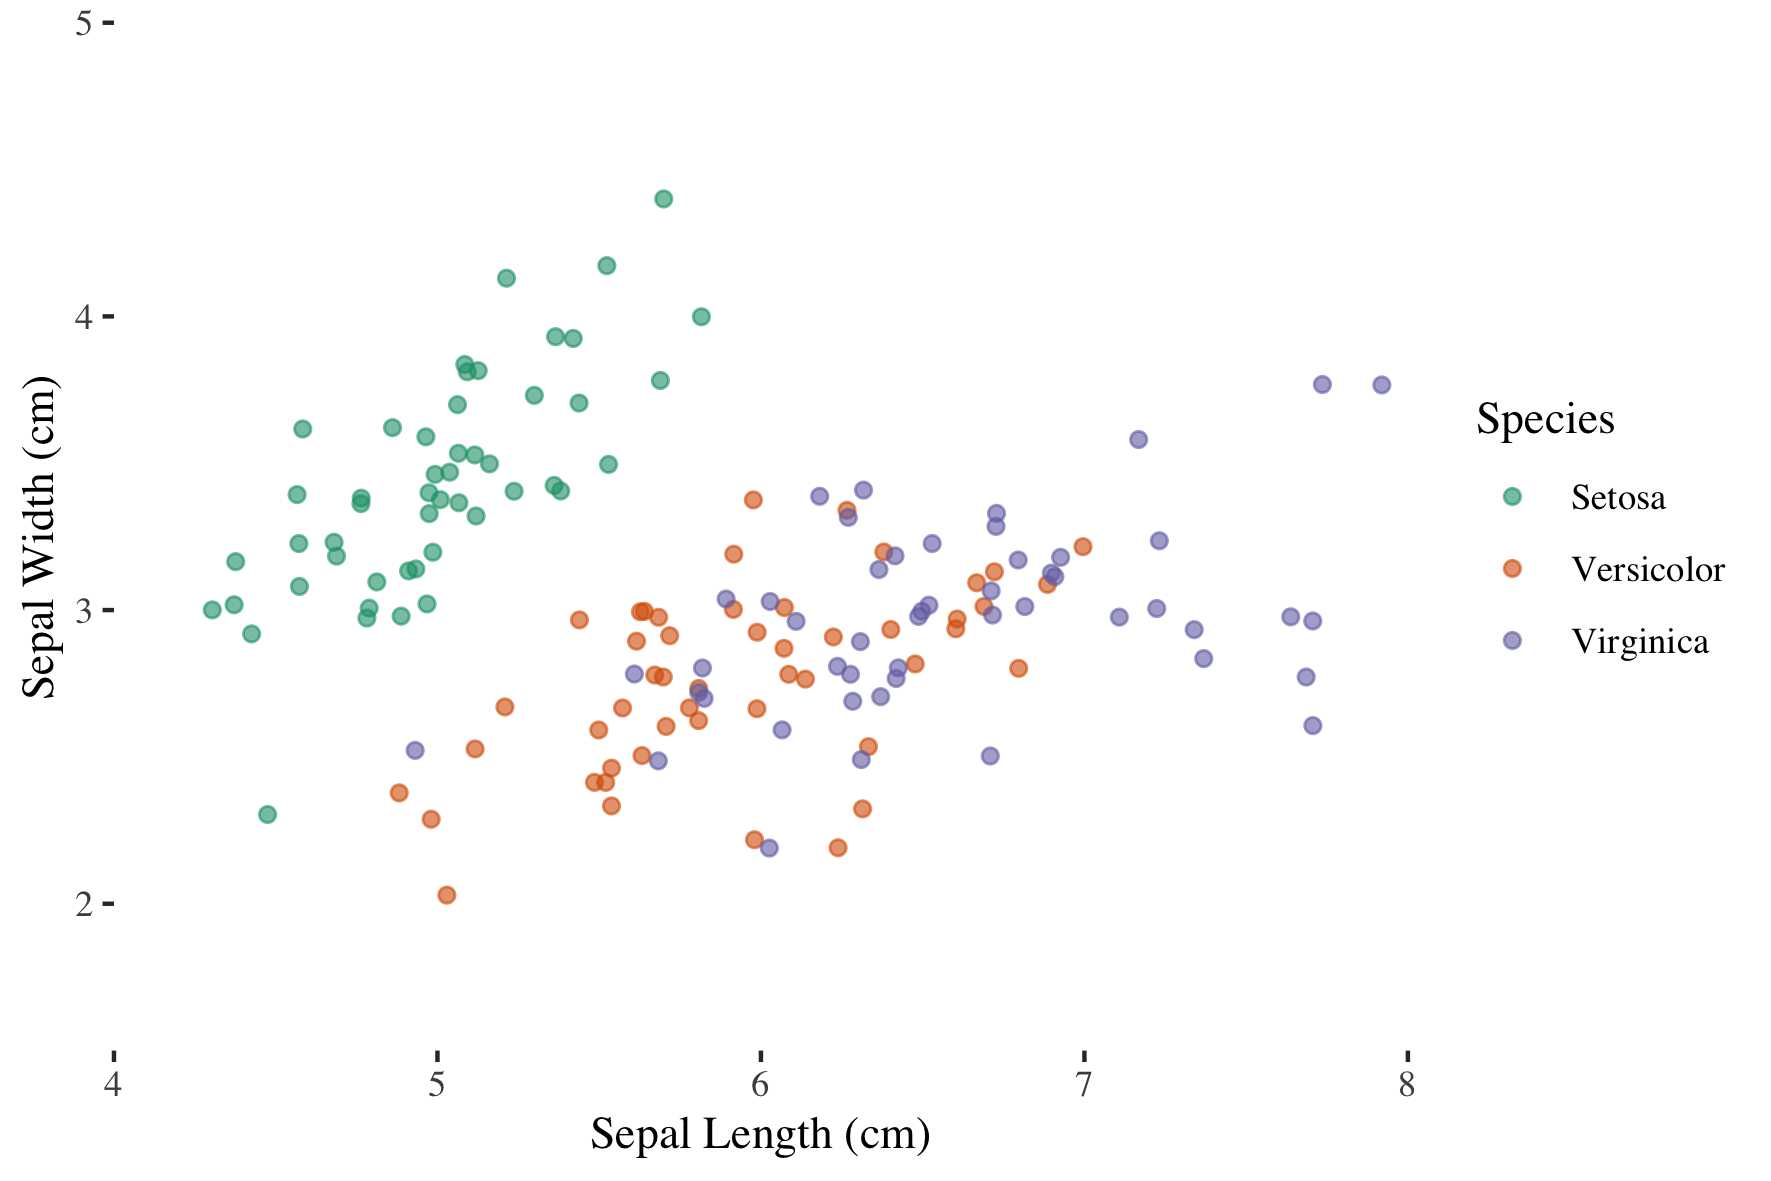
ใช้แพ็กเกจ ggthemes สำหรับฟังก์ชันเพิ่มเติม

library(ggthemes)
z + 
  theme_tufte()
การแสดงผลข้อมูลด้วย ggplot2 เบื้องต้น

วิธีใช้งานธีม

  1. สร้างจากศูนย์ (วิดีโอที่แล้ว)
  2. อ็อบเจกต์เลเยอร์ธีม
  3. ธีมในตัว
    • แพ็กเกจ ggplot2 หรือ ggthemes
  4. ธีมในตัวจากแพ็กเกจอื่น
  5. อัปเดต/กำหนดธีมเริ่มต้น
การแสดงผลข้อมูลด้วย ggplot2 เบื้องต้น

การอัปเดตธีม

original <- theme_update(text = element_text(family = "serif", size = 14),
                         rect = element_blank(),
                         panel.grid = element_blank(),
                         title = element_text(color = "#8b0000"),
                         axis.line = element_line(color = "black"))
การแสดงผลข้อมูลด้วย ggplot2 เบื้องต้น

การอัปเดตธีม

z

การแสดงผลข้อมูลด้วย ggplot2 เบื้องต้น

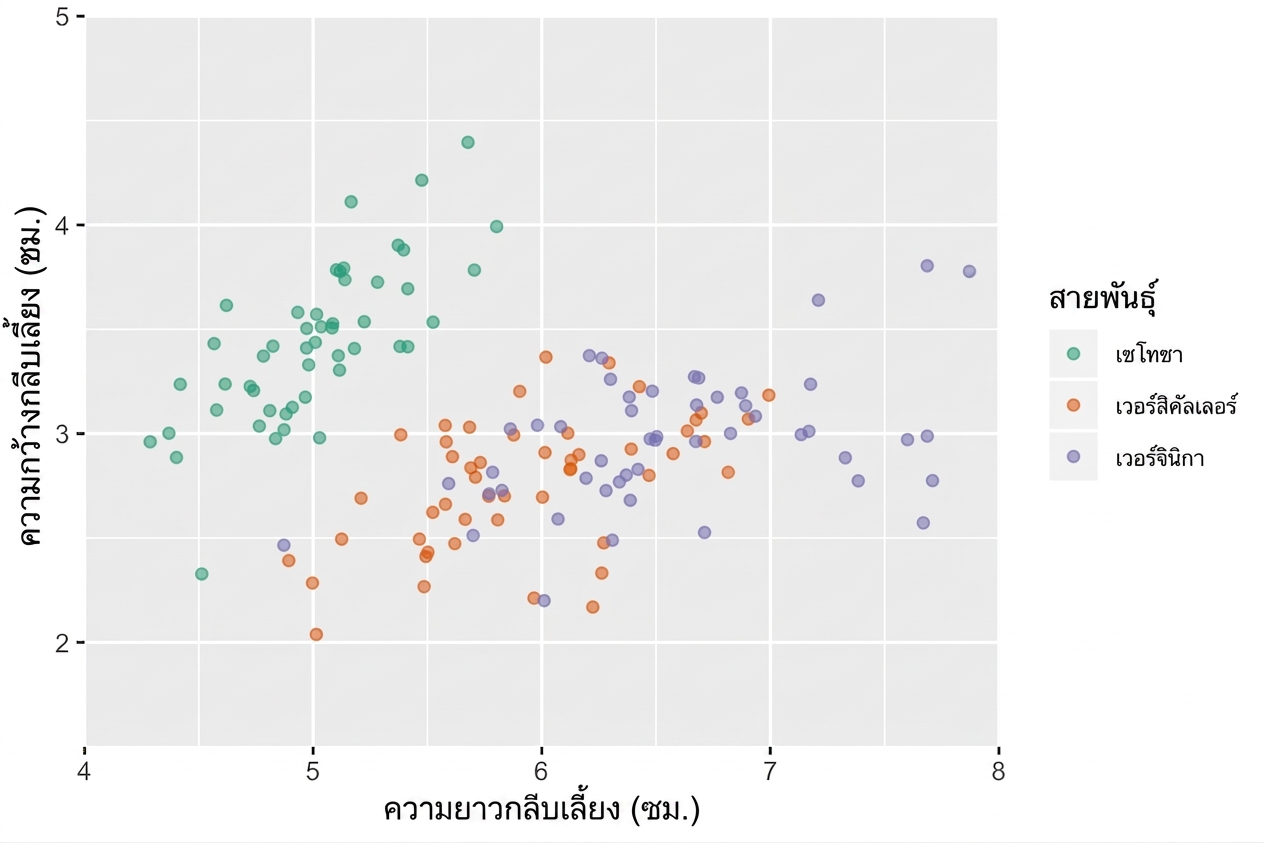
การกำหนดธีม

theme_set(original)

# Alternatively
# theme_set(theme_grey())
การแสดงผลข้อมูลด้วย ggplot2 เบื้องต้น

มาฝึกกันเถอะ!

การแสดงผลข้อมูลด้วย ggplot2 เบื้องต้น

Preparing Video For Download...