การแสดงผลข้อมูลด้วย ggplot2 เบื้องต้น
Rick Scavetta
Founder, Scavetta Academy
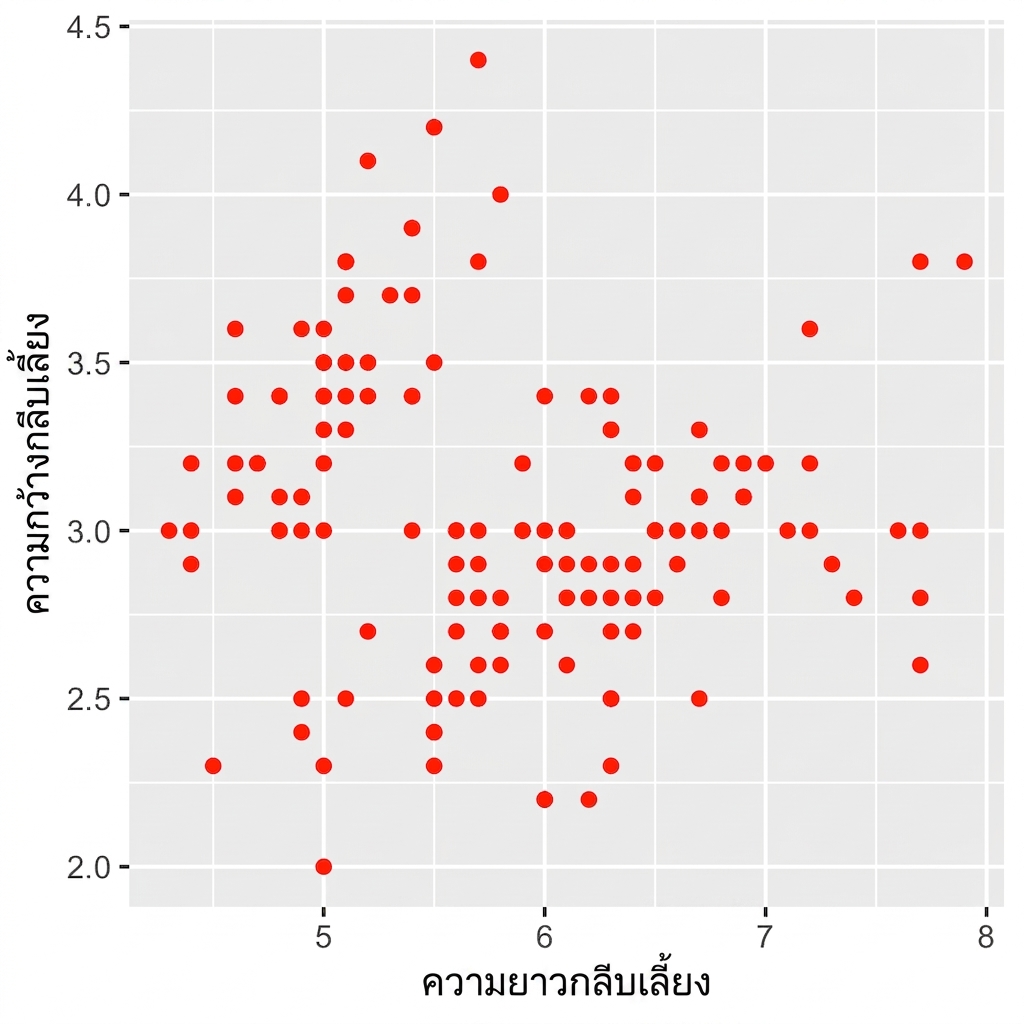
ggplot(iris, aes(x = Sepal.Length,
y = Sepal.Width)) +
geom_point(color = "red")
| ประเภท | คุณสมบัติ |
|---|---|
| Color | "red" |
กำหนด attributes ใน geom_*().
Attribute color ถูก กำหนด เป็น "red".

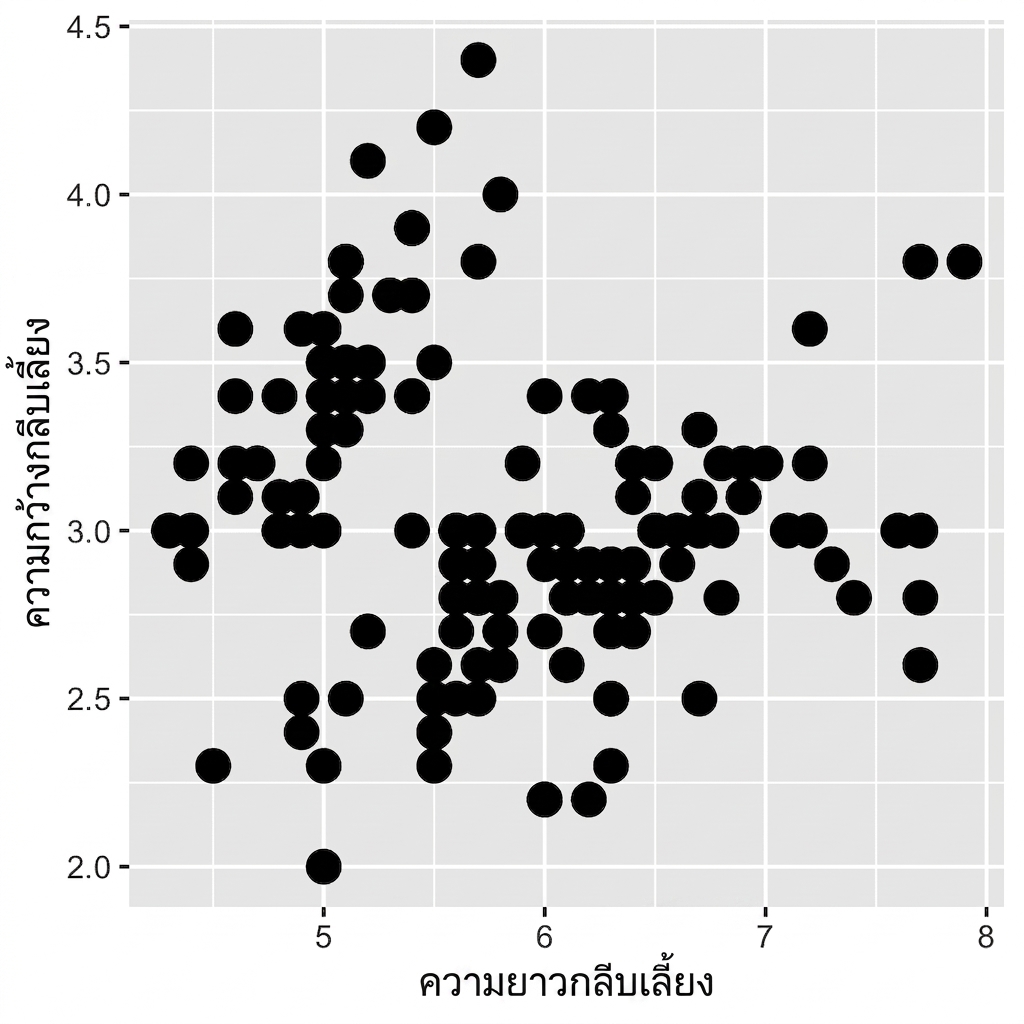
ggplot(iris, aes(x = Sepal.Length,
y = Sepal.Width)) +
geom_point(size = 10)
| ประเภท | คุณสมบัติ |
|---|---|
| Size | 4 |

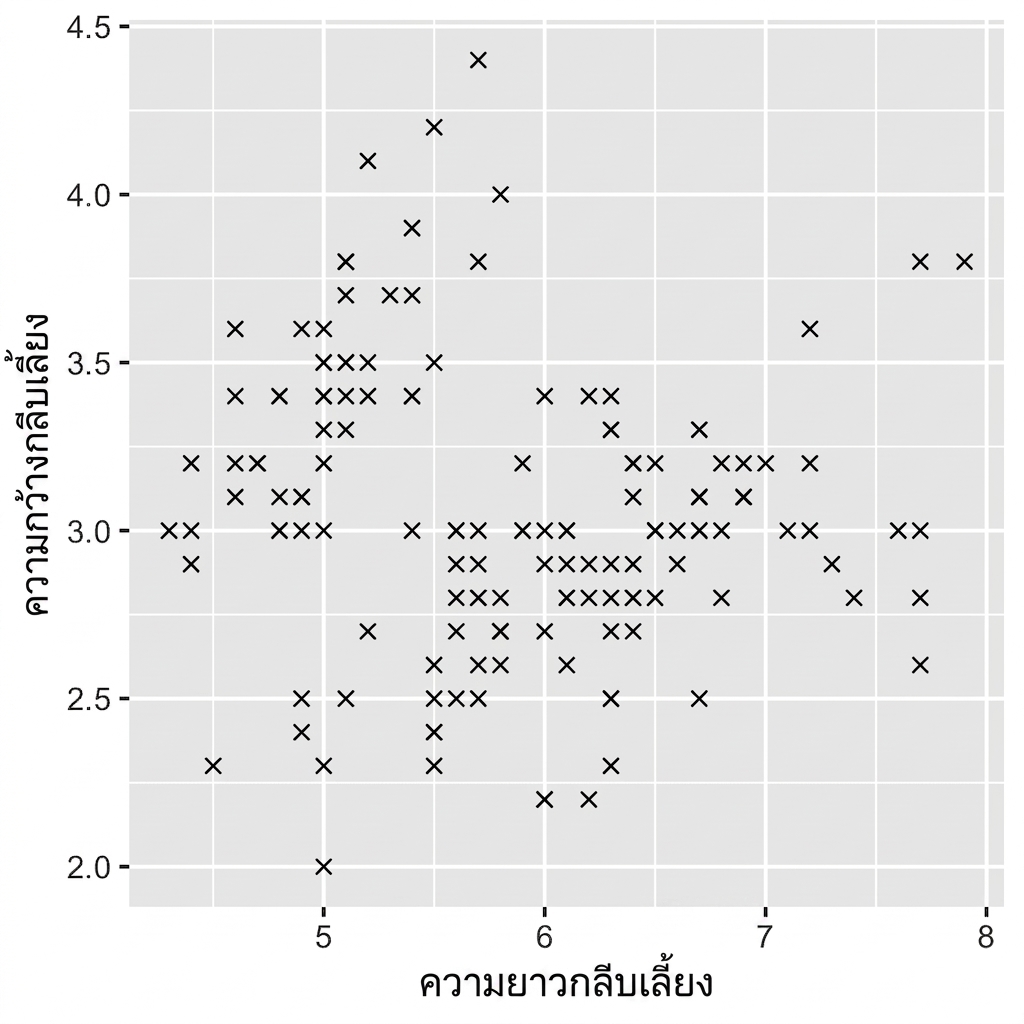
ggplot(iris, aes(x = Sepal.Length,
y = Sepal.Width)) +
geom_point(shape = 4)
| ประเภท | คุณสมบัติ |
|---|---|
| Shape | 4 |

การแสดงผลข้อมูลด้วย ggplot2 เบื้องต้น