แนวปฏิบัติที่ดีด้าน Aesthetics
การแสดงผลข้อมูลด้วย ggplot2 เบื้องต้น

Rick Scavetta
Founder, Scavetta Academy
รูปแบบตามหน้าที่
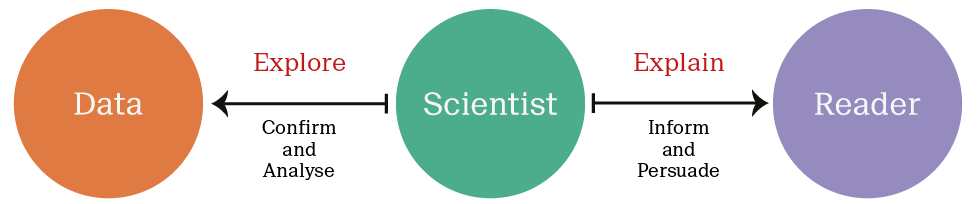
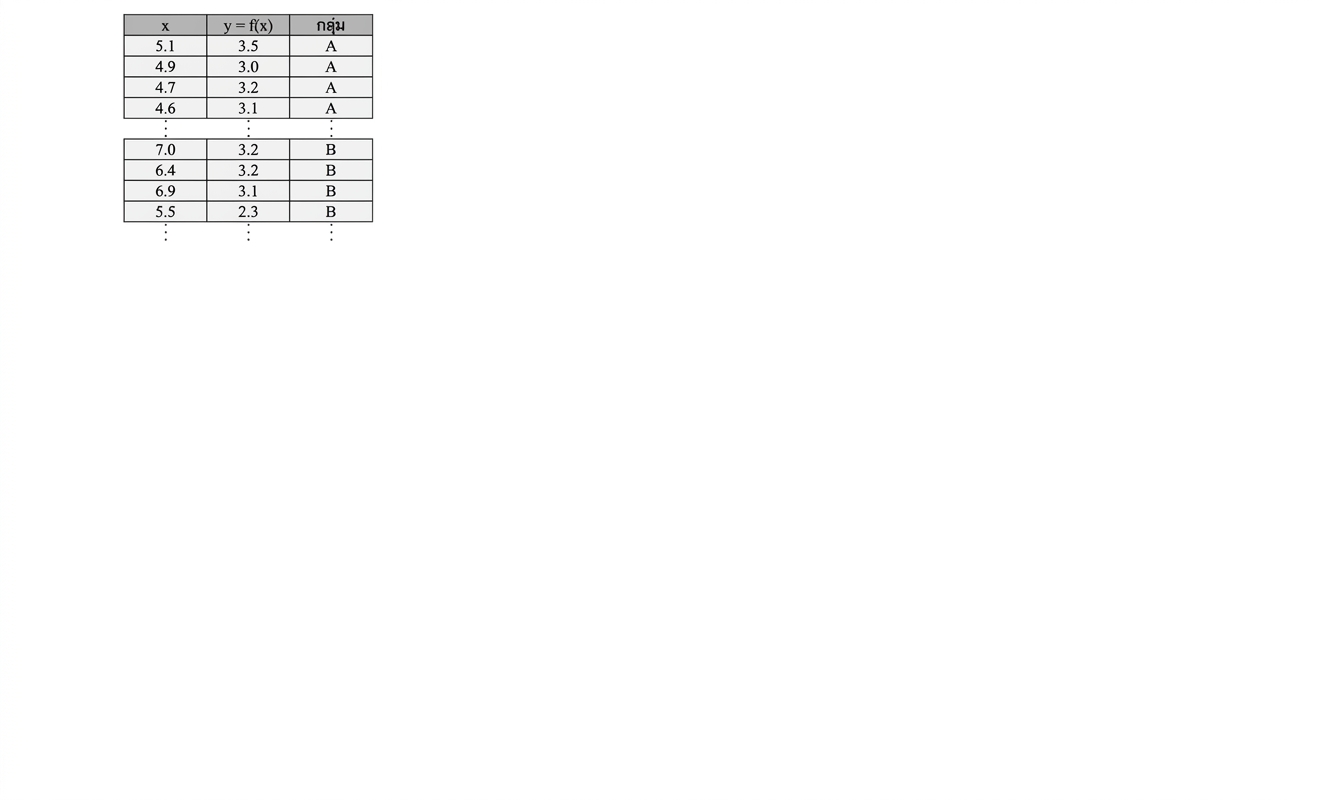
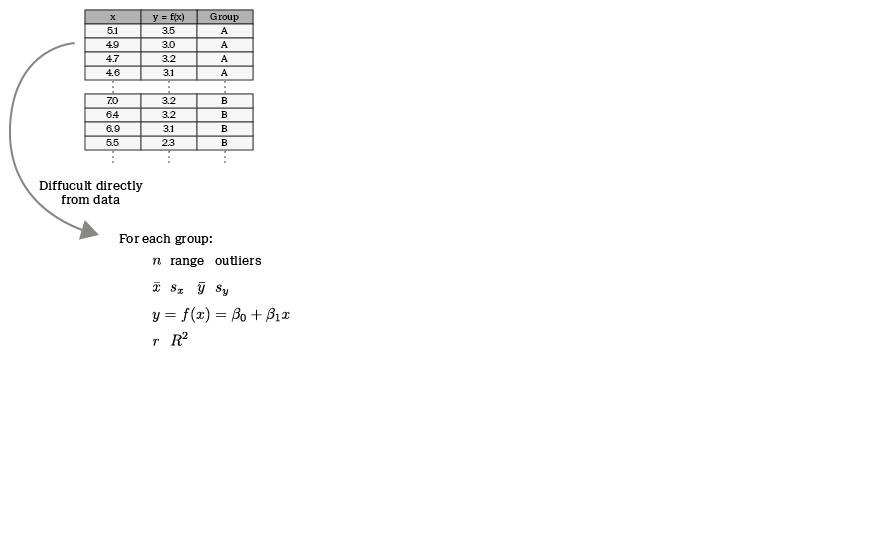
การดึงข้อมูลสารสนเทศจากข้อมูล

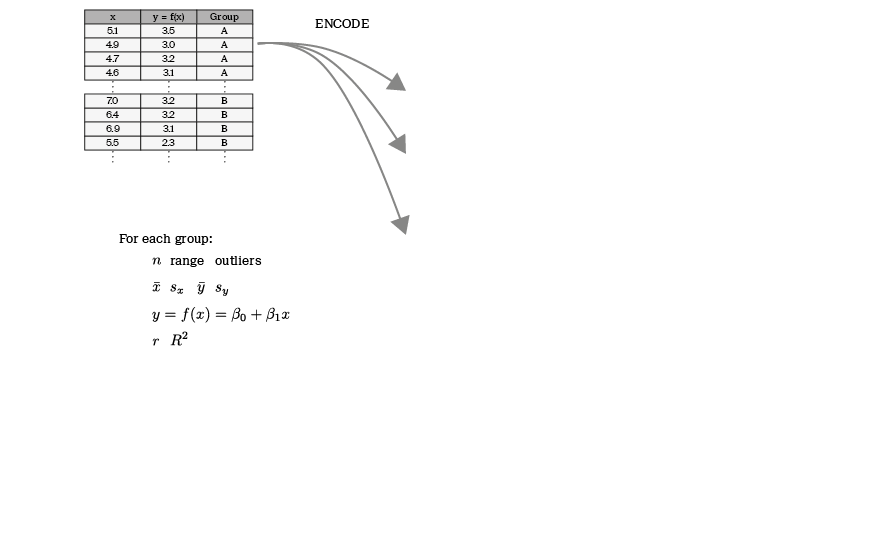
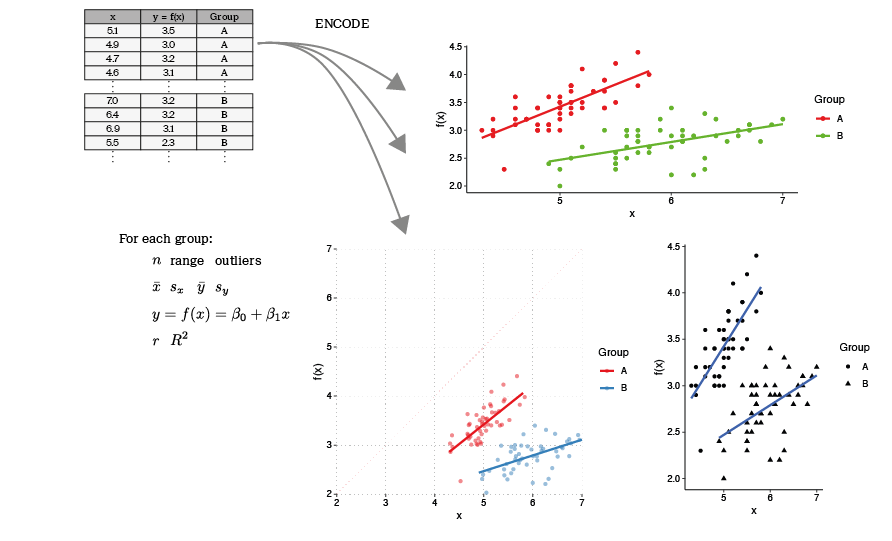
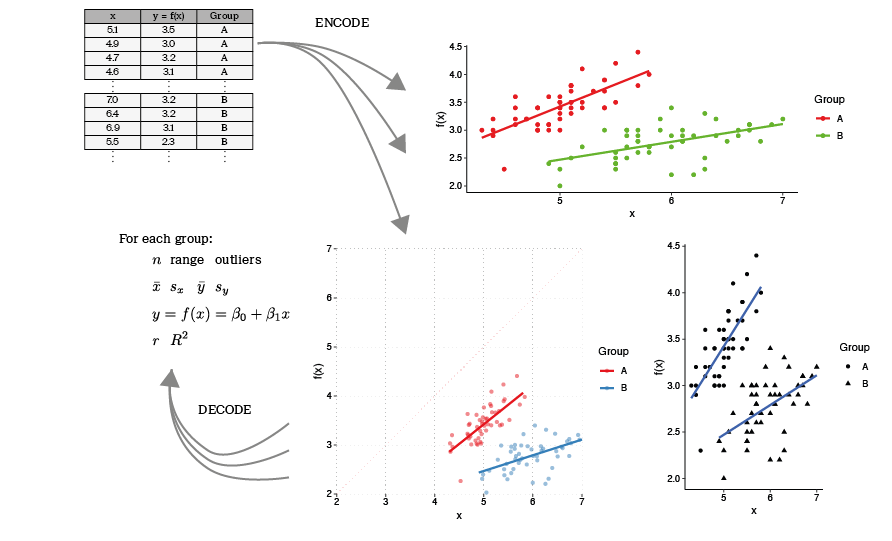
Aesthetics - ตัวแปรต่อเนื่อง
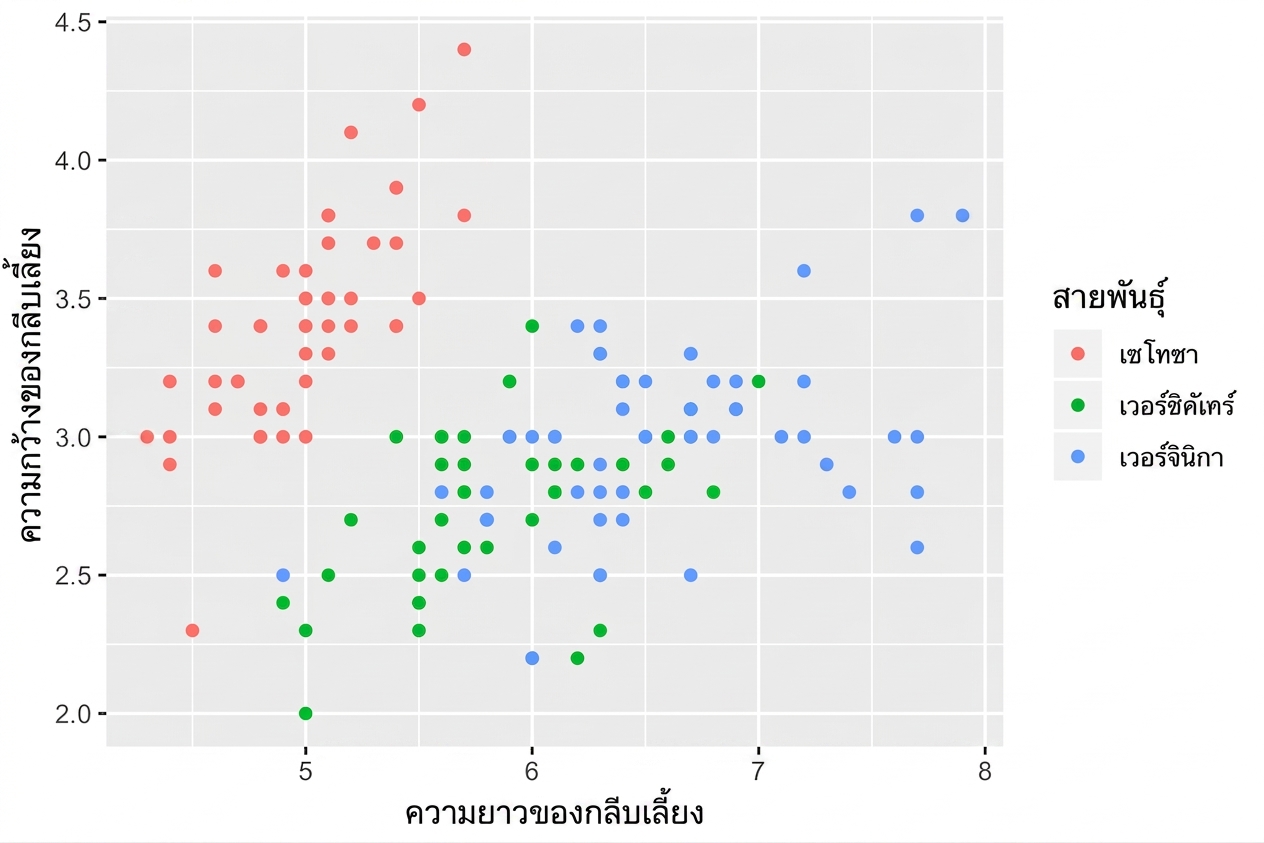
Aesthetics - ตัวแปรต่อเนื่อง
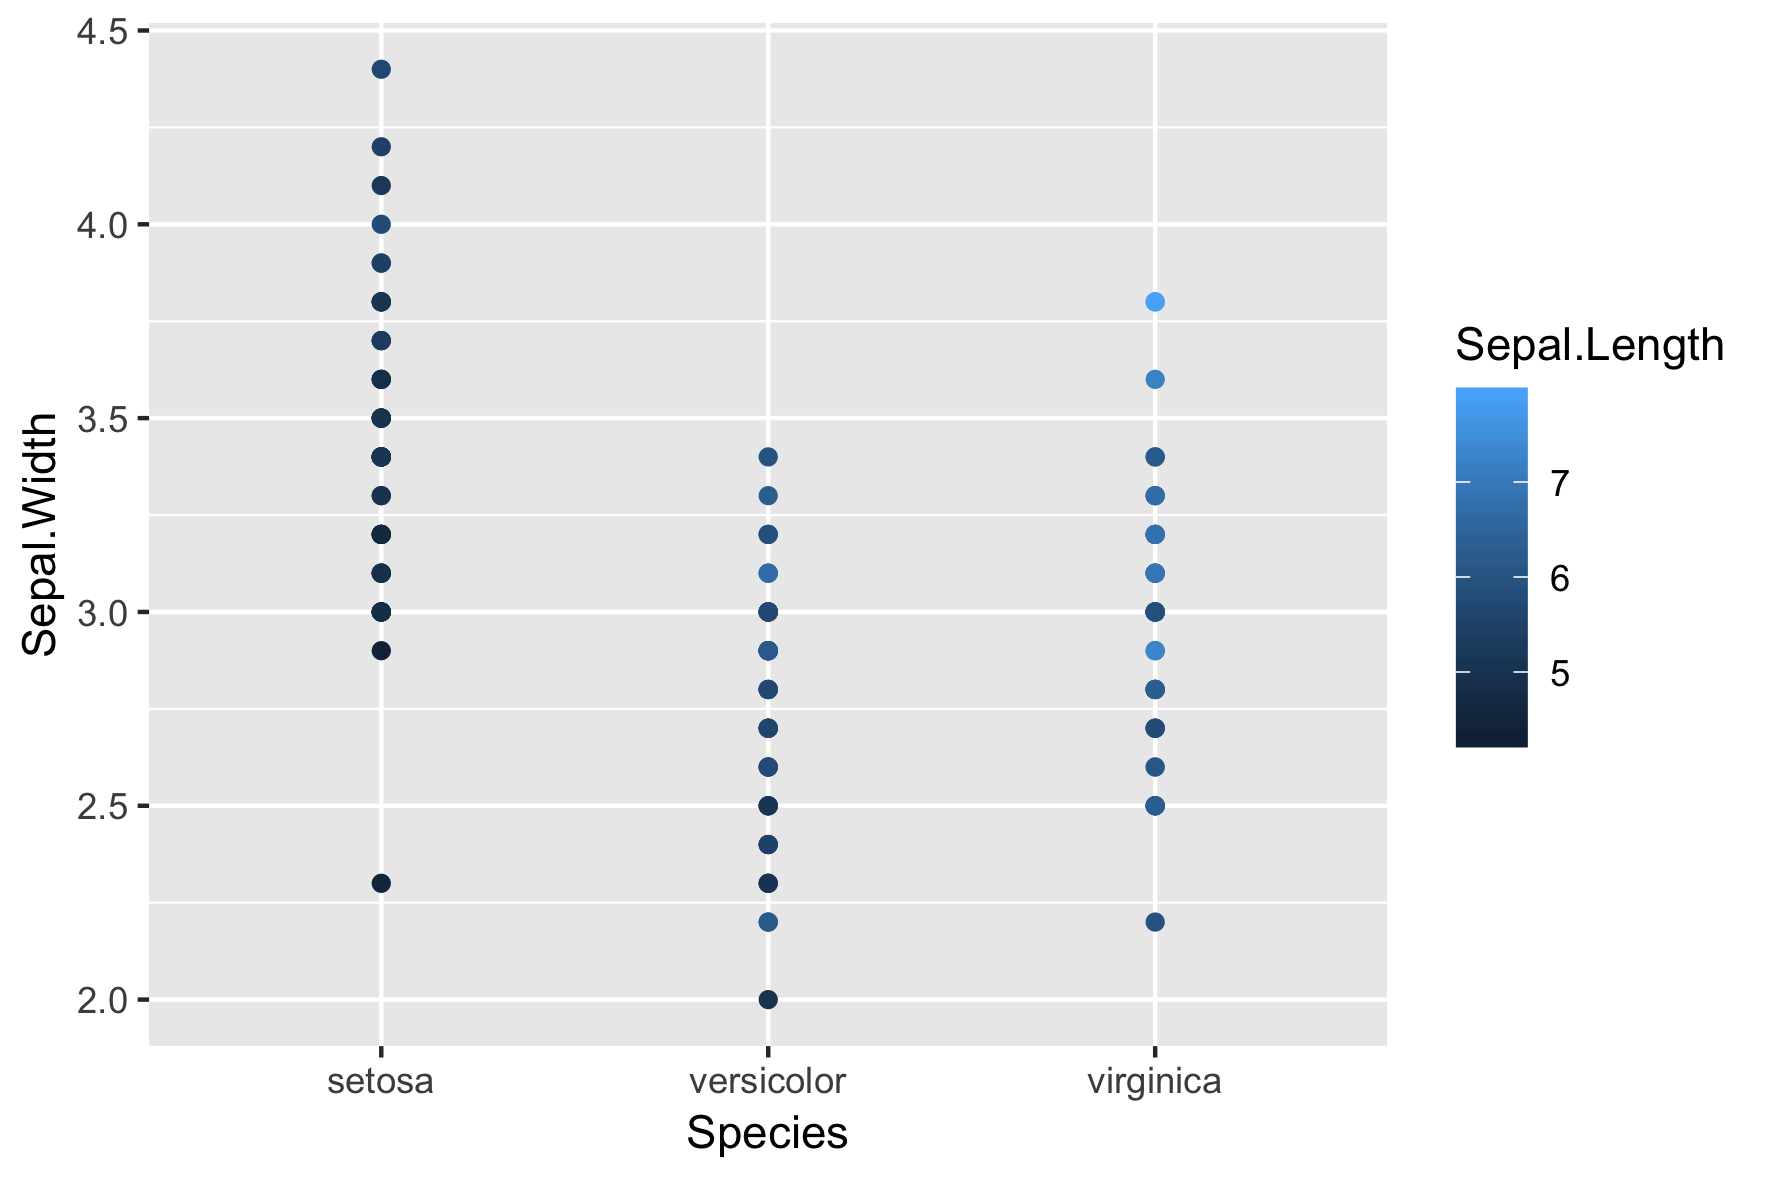
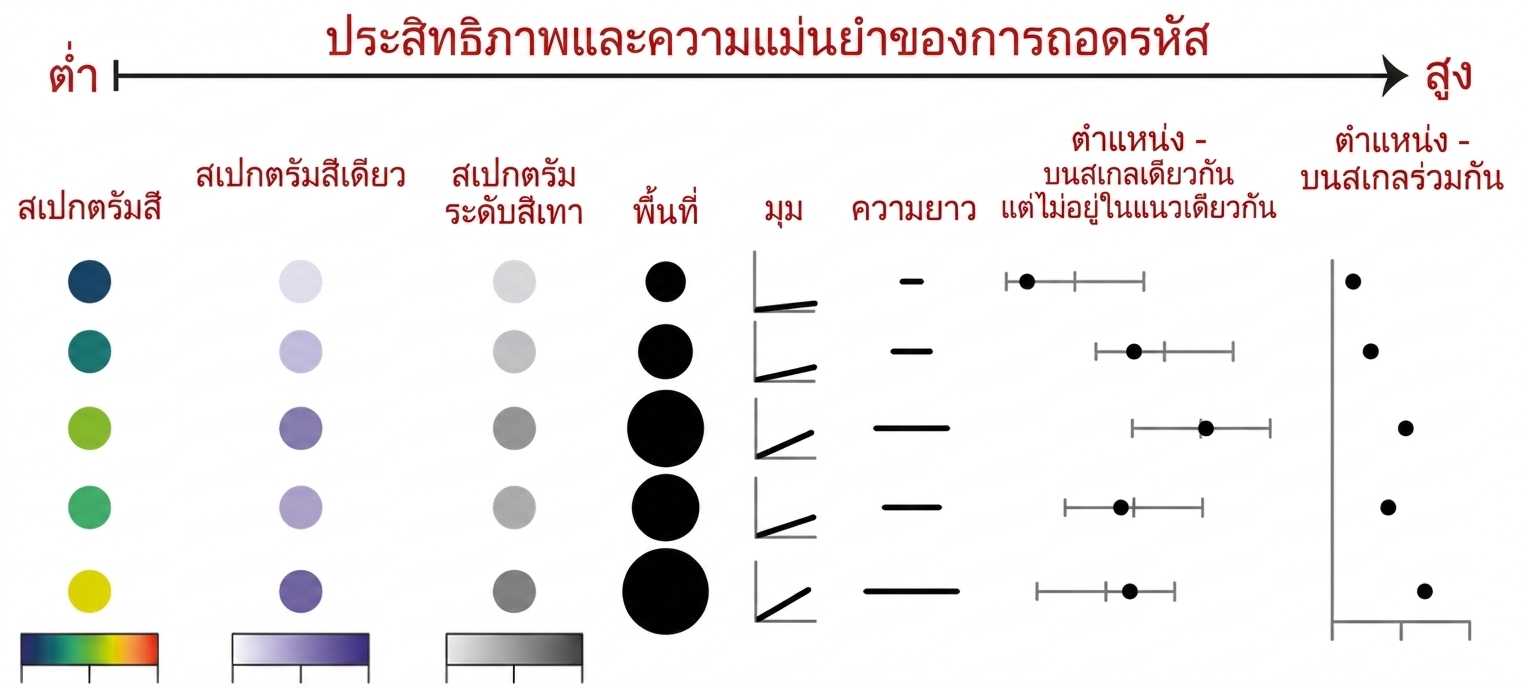
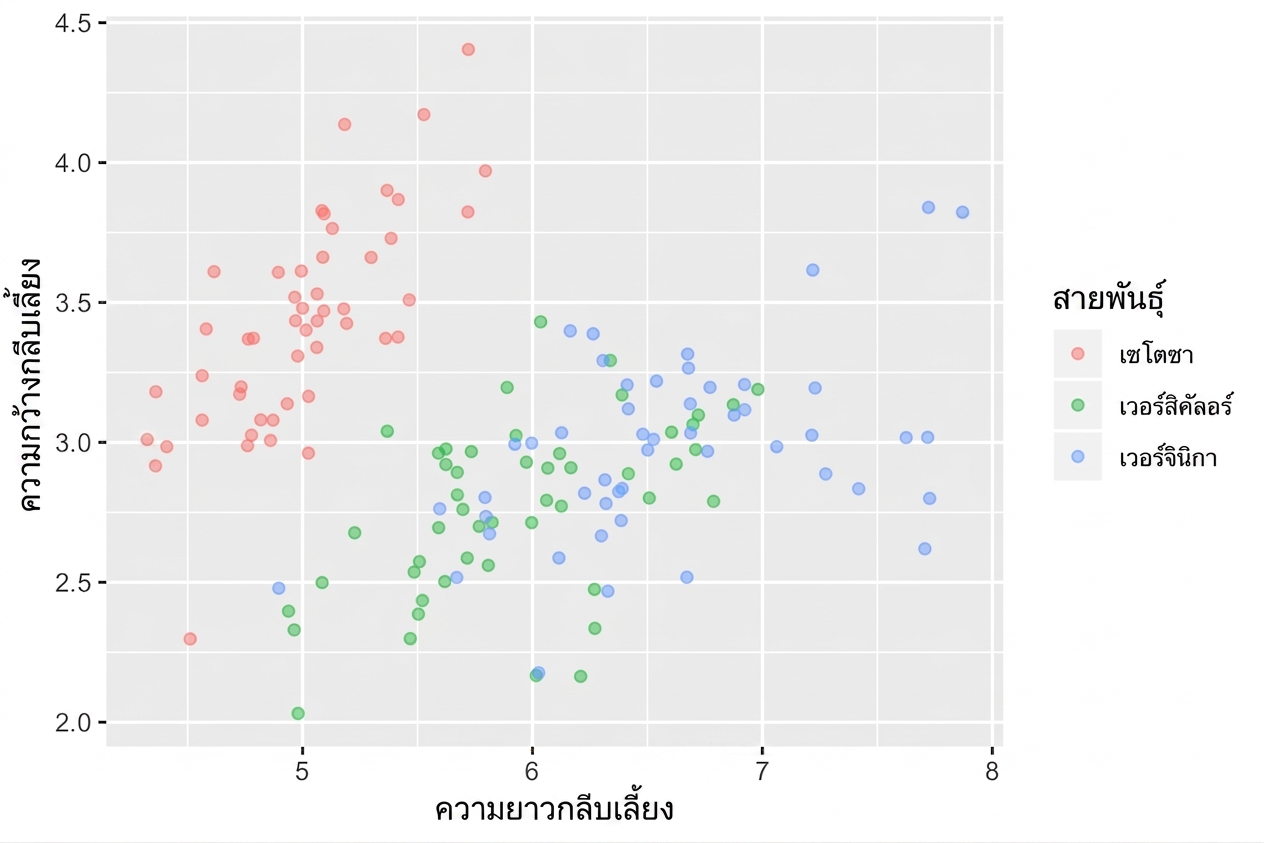
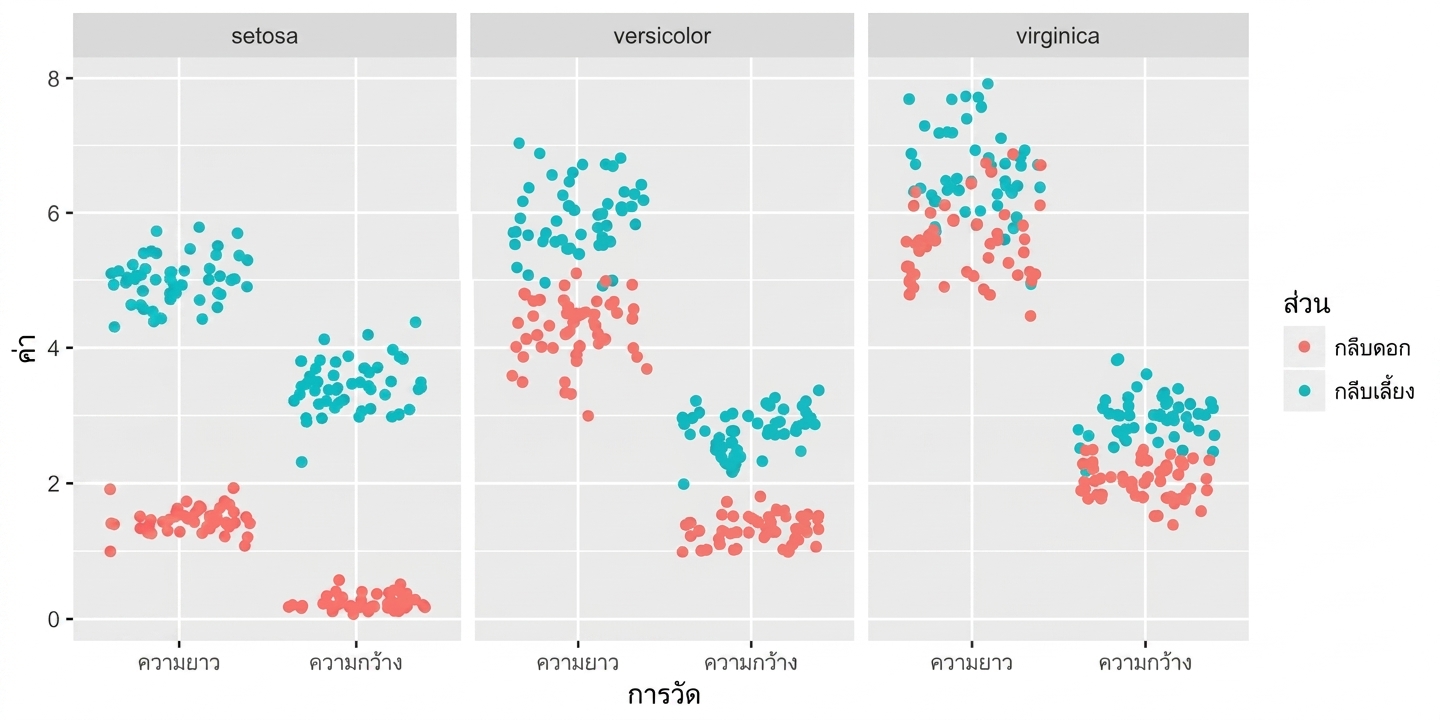
กราฟกระจาย iris สามแบบ
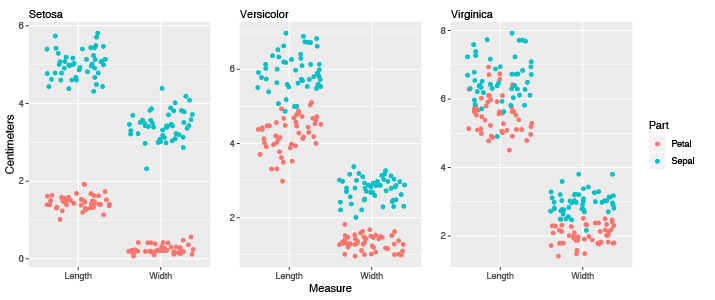
กราฟกระจาย iris สามแบบ แกน y ไม่ตรงกัน
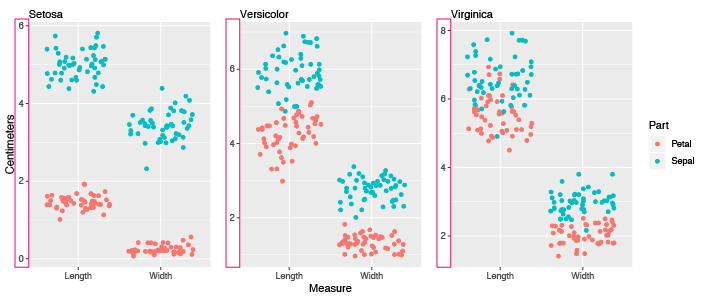
กราฟ facet เดียว แกน y ร่วมกัน
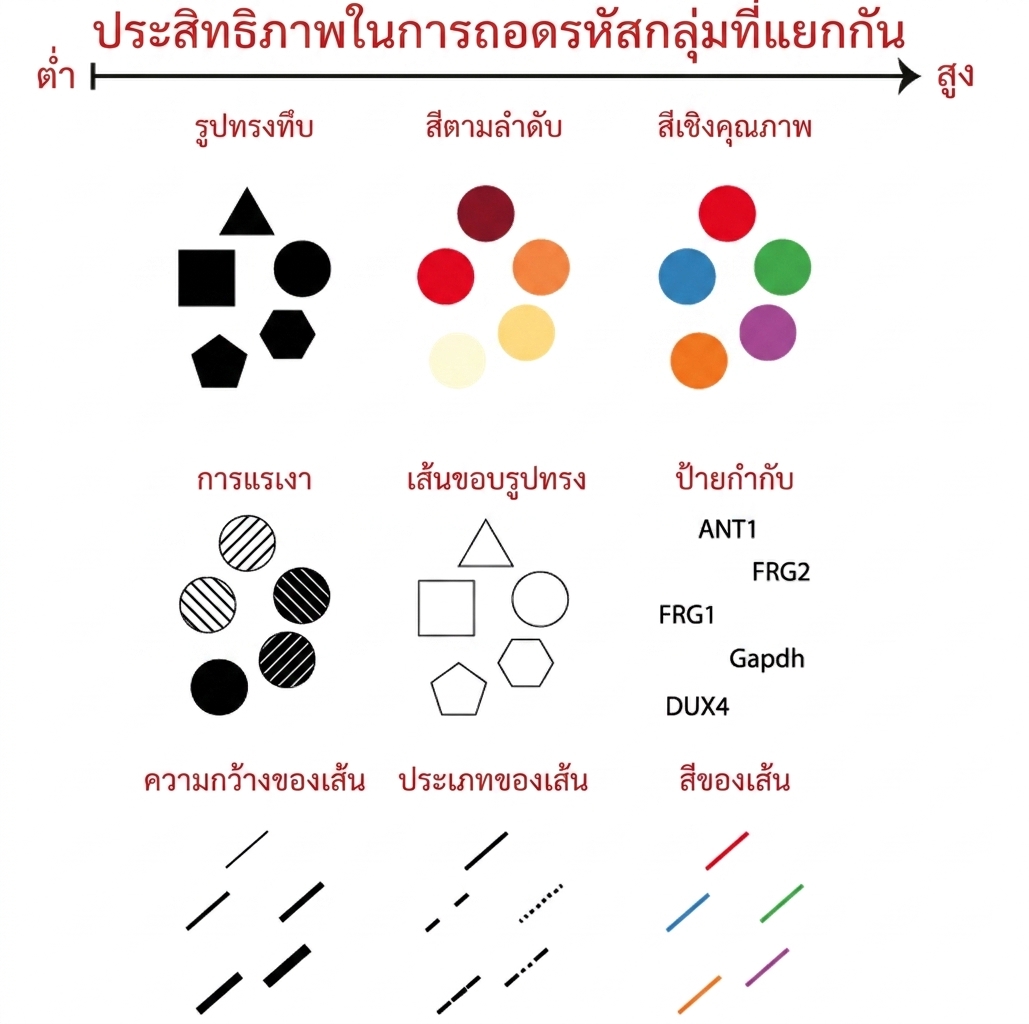
Aesthetics - ตัวแปรเชิงหมวดหมู่
Aesthetics - ตัวแปรเชิงหมวดหมู่